. 2004 Jan 6;101(1):221-6.
doi: 10.1073/pnas.2637010100. Epub 2003 Dec 19.

Shifting foci of hematopoiesis during reconstitution from single stem cells

Affiliations

Shifting foci of hematopoiesis during reconstitution from single stem cells

Yu-An Cao et al. Proc Natl Acad Sci U S A. .

Abstract

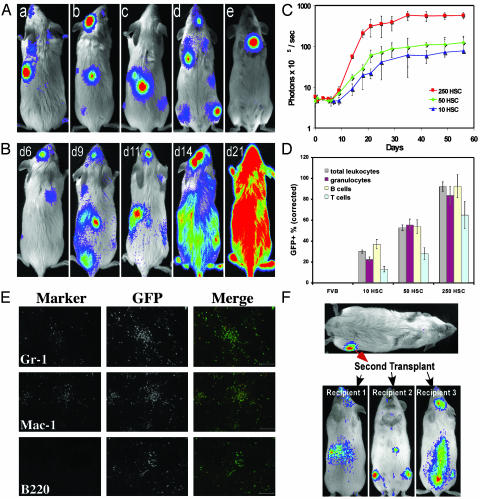
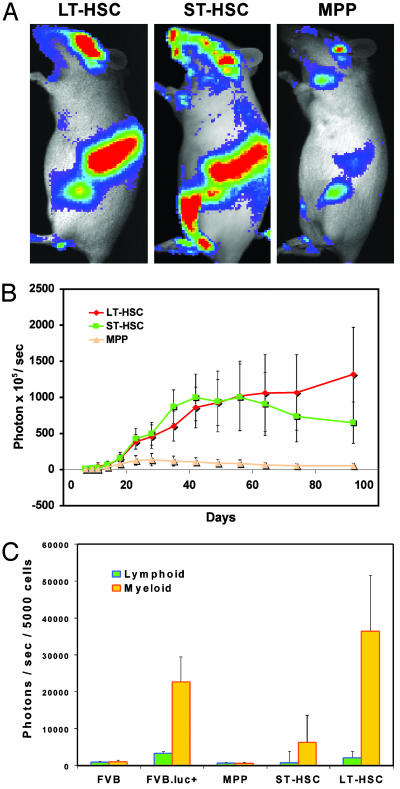
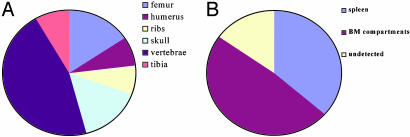
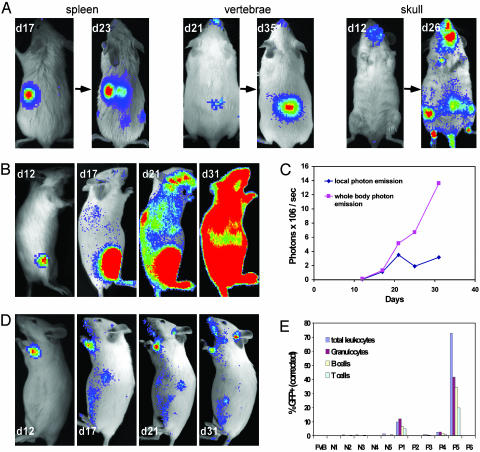
To reveal the early events and dynamics of hematopoietic reconstitution in living animals in real-time, we used bioluminescence imaging to monitor engraftment from single luciferase-labeled hematopoietic stem cells (HSC) in irradiated recipients. Transplanted HSC generated discrete foci in the spleen and bone marrow (BM), at a frequency that correlated with BM compartment size. Initially detected foci could expand locally, seed other sites in BM or spleen, and/or recede with different kinetics. These studies reveal dynamic and variable patterns of engraftment from highly purified HSC and indicate that the final overall contribution of individual HSC to hematopoietic chimerism does not depend on the specific site of initial engraftment and expansion.


Figures

Fig. 1.
Fig. 1.
Dynamics of HSC engraftment from luc+ or luc+ GFP+ HSC. HSC were sorted from transgenic mice and transplanted into lethally irradiated nontransgenic recipients. BLI was used to monitor the engraftment of HSC. All images are displayed at the same scale. (A) Bioluminescent foci derived from 50 transplanted luc+ HSC were apparent in individual animals at anatomic sites corresponding to the location of the spleen, skull, vertebrae, femurs, and sternum (a to e, respectively) at 6–9 days after transfer. (B) The patterns of engraftment were dynamic with formation and expansion or formation and loss of the bioluminescent foci. One recipient of 250 HSC monitored over time is shown. In this animal, two initial foci were apparent on day 6. By day 9, one was no longer detectable and another remained at nearly the same intensity as on day 6. New foci were apparent on day 9, and then the intensity at these sites weakened or disappeared by day 11. The intensity of the spleen signal increased steadily. By day 21, a significant degree of engraftment had been achieved. (C) Dynamics of the hematopoietic engraftment from 10, 50, or 250 luc+ or luc+ GFP+ HSC. HSC were transplanted along with 3 × 10⁵ whole BM cells from nontransgenic donors, and the dorsal view whole body bioluminescence emission was measured at different time points. Each time point is represented by at least four animals, and data were obtained from dorsal view whole body imaging and are plotted as photons per sec per mouse. (D) Engraftment of hematopoietic lineages was determined by flow cytometric analysis of peripheral blood at 8 weeks after transplant of 10, 50, or 250 luc+ GFP+ HSC. Peripheral blood cells of wild-type FVB mice (FVB) were analyzed in parallel as a negative control. Data are presented as the mean percent GFP+ cells for the indicated subsets and are corrected for GFP transgene expression as described in Materials and Methods. (E) Immunofluorescence analysis of spleens recovered from luc+ GFP+ HSC-transplanted animals exhibiting splenic bioluminescent foci-revealed clusters of GFP+ mature myeloid cells expressing the markers Mac-1 and Gr-1. (Scale bar = 100 μm.) (F) Whole BM from the bioluminescent femur of a recipient of 250 luc+ HSC was harvested on day 12 and transplanted into irradiated secondary nontransgenic recipients who subsequently showed detectable engraftment by luc+ cells in multiple BM compartments and in the spleen on day 14.
Fig. 2.
Fig. 2.
Engraftment kinetics of different populations of HSC. Five hundred luc+ LT-HSC, ST-HSC, or MPP were transplanted into lethally irradiated nontransgenic recipients along with 3 × 10⁵ nontransgenic whole BM cells. BLI was performed at different time points. (A) Images were taken on day 18 after transplantation and are displayed at the same scale. The most active tissues for hematopoietic reconstitution were spleen, vertebrae, skull, and femur in all groups. (B) Kinetics of LT-HSC, ST-HSC, and MPP engraftment. Values were obtained from dorsal view whole body imaging and are plotted as photons per sec per mouse. Data are plotted as the mean (±SD) for the entire group (n = 7 for LT-HSC, n = 9 for ST-HSC, and n = 5 for MPP). (C) Lineage analysis of hematopoietic engraftment. luc+ LT-HSC, ST-HSC, or MPP were transplanted into recipient mice, and, 15 weeks after transplantation, mature lymphoid (B220+ or CD3+) or myeloid (Mac-1+Gr-1+) cells were sorted by FACS from the peripheral blood for luciferase assay. Data are plotted as the average (±SD) bioluminescent signal from duplicate assays for seven LT-HSC, nine ST-HSC, and five MPP recipients. Cells from wild-type FVB (FVB) and luc+ transgenic (FVB.luc+) mice were analyzed in parallel as negative or positive controls, respectively. Multilineage (myeloid plus lymphoid) chimerism was maintained in seven of seven LT-HSC-, four of nine ST-HSC-, and zero of five MPP-transplanted animals.
Fig. 3.
Fig. 3.
Frequent locations of original bioluminescent foci derived from single HSC. Single luc+ or luc+ GFP+ KTLS HSC were transplanted into lethally irradiated nontransgenic recipients along with 3 × 10⁵ nontransgenic Sca-1- BM cells. BLI was performed on day 12–23 after transplantation, and at these time points, single bioluminescent foci were visualized from 23 of a total of 113 recipients at different time points; four recipients showed no single bioluminescent foci on days 12–23 but did show detectable levels of hematopoietic engraftment after 4 weeks and therefore were categorized as undetected at the early time point. (A) Frequent sites among different BM compartments where bioluminescent foci were initially detected. (B) The frequency of bioluminescent foci detected from spleen or BM compartments.
Fig. 4.
Fig. 4.
Single HSC engraftment. Single luc+ or luc+ GFP+ KTLS HSC were injected i.v. into lethally irradiated FVB recipients along with 3 × 10⁵ Sca-1-depleted BM cells as a radioprotective population. All images are displayed at the same scale. (A) Representative images showing single HSC-engrafted mice in which single foci from spleen, vertebrae, and skull were observed. These foci expanded with time, and new detectable sites became apparent at later time points. (B) Right lateral view images were taken on days 12, 17, 21, and 31 from one animal in which one initial bioluminescent focus was visualized on day 12 after transplantation. By day 31, a significant degree of hematopoietic reconstitution was apparent. (C) Kinetics of hematopoietic reconstitution of the recipient shown in B showed steady increases in whole body bioluminescent emission with relatively stable signal detected from the initial focus (local photon emission). (D) One focus from another single HSC recipient yielded only low-level hematopoietic engraftment. Left lateral view images were taken on days 12, 17, 21, and 31. (E) Chimerism evaluation of peripheral blood of the single luc+ GFP+ HSC recipients in a representative experiment, including wild-type FVB and recipients with (P1–6) and without (N1–5) initial foci. At week 5, 72.7% of hematopoietic cells from P5 (recipient shown in B) were derived from donor HSC, whereas only 0.3% of those from P6 (recipient shown in D) were derived from the labeled donor cell.

References

    1. Spangrude, G. J., Heimfeld, S. & Weissman, I. L. (1988) Science 241, 58-62. - PubMed
    1. Morrison, S. J. & Weissman, I. L. (1994) Immunity 1, 661-673. - PubMed
    1. Aizawa, S. & Tavassoli, M. (1988) Proc. Natl. Acad. Sci. USA 85, 3180-3183. - PMC - PubMed
    1. Hardy, C. L. (1995) Am. J. Med. Sci. 309, 260-266. - PubMed
    1. Hendrikx, P. J., Martens, C. M., Hagenbeek, A., Keij, J. F. & Visser, J. W. (1996) Exp. Hematol. (Charlottesville, Va) 24, 129-140. - PubMed

Publication types

LinkOut - more resources