

doi: 10.1097/00004424-199212002-00011.
Magnetic resonance imaging mapping of brain function. Human visual cortex
Affiliations
- PMID: 1468876
- PMCID: PMC4097384
- DOI: 10.1097/00004424-199212002-00011
Item in Clipboard
Magnetic resonance imaging mapping of brain function. Human visual cortex
Invest Radiol.
1992 Dec.
Abstract
Magnetic resonance imaging (MRI) studies of human brain activity are described. Task-induced changes in brain cognitive state were measured using high-speed MRI techniques sensitive to changes in cerebral blood volume (CBV), blood flow (CBF), and blood oxygenation. These techniques were used to generate the first functional MRI maps of human task activation, by using a visual stimulus paradigm. The methodology of MRI brain mapping and results from the investigation of the functional organization and frequency response of human primary visual cortex (V1) are presented.
Figures
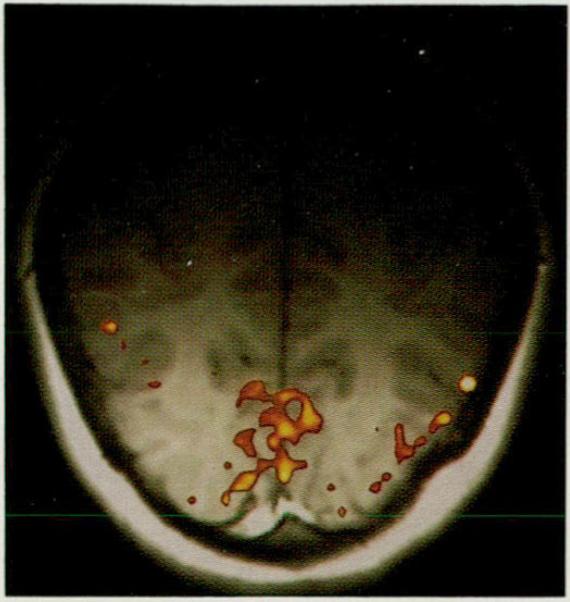
Magnetic resonance functional/anatomic map of the brain during 8-Hz patterned-flash visual stimulation . Image intensity (color) is proportional to CBV, superimposed onto an anatomic (T1 -weighted) image . Image is aligned along the calcarine fissure with the occipital pole at the bottom. During photic stimulation lo cal increases in blood volume are detected in the medial-posterior regions of the occipital lobes along the banks of the calcarine fissures. A linear color scale was used , with red equivalent to greatest activity. A marked area (approximately 600 mm2) of increased blood volume (approximately 24%) is localized in the anatomically defined primary visual cortex. This CBV image was acquired using a 3 × 3 × 10-mm voxel.
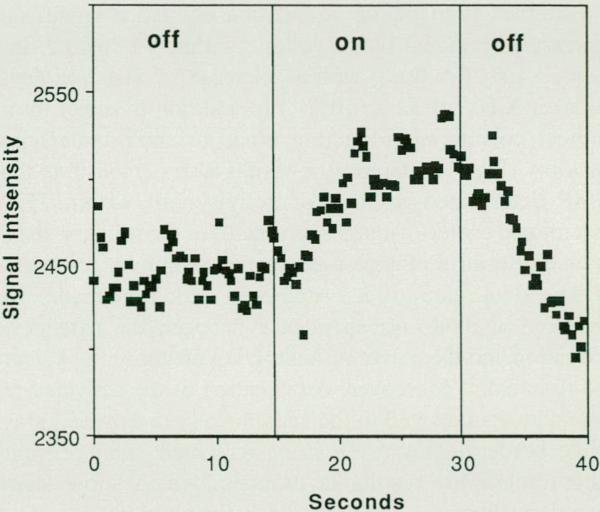
Real-time magnetic resonance imaging mapping of V1 activation during visual stimulation . Signal intensity changes for a region of interest (approximately 50 mm2) within the visual cortex during darkness and during 8-Hz patterned-flash visual stimulation. An echo planar gradient echo technique (TEITR, 50/250 mseconds; rf angle = 40) was used , sensitive to changes in the oxygenation state of hemoglobin. Hemodynamic activity was detected with a temporal resolution of 250 mseconds. The mean rise-time constant of the signal change was approximately 4 seconds.
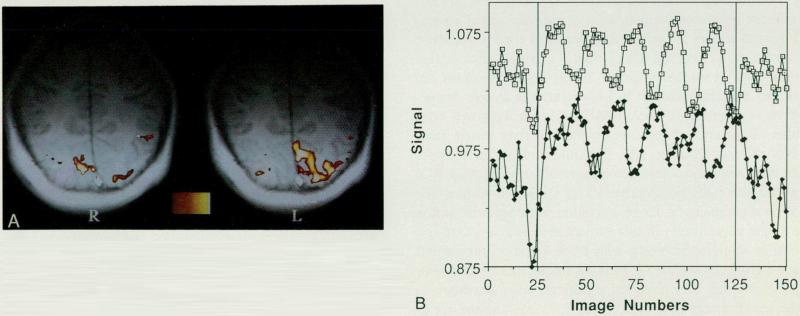
(A) Alternating hemifield activation. The stimulus was a black and white counterphased (8 Hz) semiannular checkerboard. Left and right visual fields were stimulated, alternating every 20 seconds. Dynamic changes in cortical activation (left and right V1) exactly follow the reversal frequency of the visual field. Images were acquired using an echo planar gradient echo (TR = 2 seconds, TE = 50 mseconds) blood oxygenation-sensitive sequence. Hemifield activation maps are superimposed on the corresponding T1-weighted anatomic image. The response to stimulation of the left hemifield is shown on the left and the response to stimulation of the right hemifield is shown on the right. Diminished cortical response in the right hemisphere is due to anatomic asymmetry. (B) Dynamic hemifield experiment time course. Echo planar gradient echo (TR = 2 seconds, TE = 50 mseconds) signal intensity from a region of interest in either the left (open squares with dots) or right (closed diamonds) V1. V1 cortical activation turns on and off, following closely the switching of the stimulus between the left and right hemifields every 20 seconds.
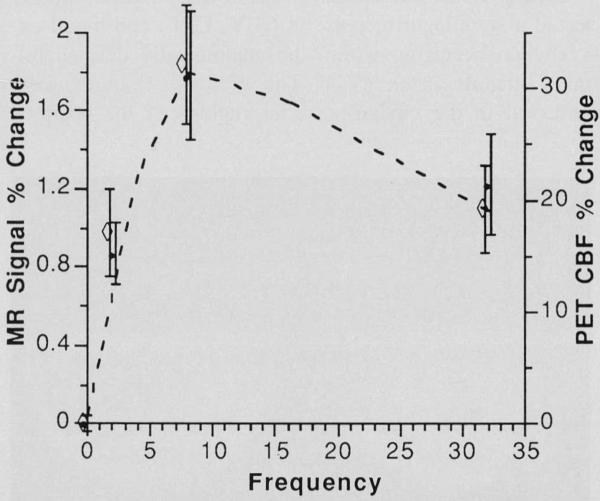
Magnetic resonance imaging gradient echo ( ◇ ) and inversion recovery (•) signal response in striate cortex as a function of the frequency (Hz) of light stimulus (0 Hz = darkness). Signal response is expressed as percent change from the baseline unstimulated level. The magnitude of the change depends on the exact choice of pulse sequence parameters, static fie ld strength, etc. The largest observed response occurred at 8 Hz for both techniques. Error bars indicate ± 1 standard error of the mean (n = 5 for 2 and 32 Hz, n = 7 for 8 Hz). For comparison, CBF % change data(--) were obtained using positron emission tomography (PET) and the identical stimulation paradigm (adapted from Fox PT, Raichle ME. Ann Neuro/1985;17:303) at 0, 1, 4, 8, 16, and 32 Hz are superimposed on the magnetic resonance imaging data.
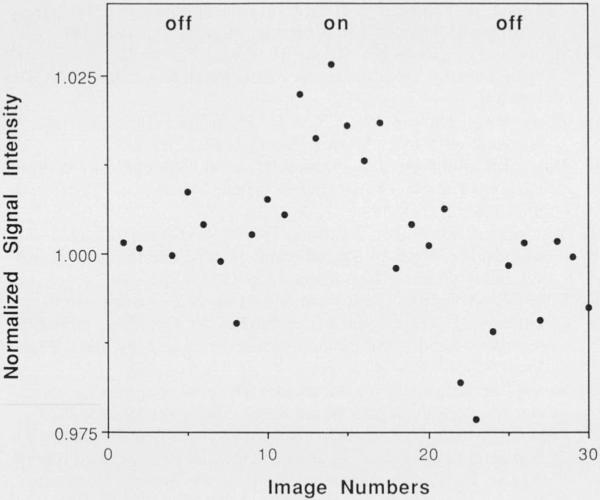
Brain activity changes observed using a conventional 1.5-T magnetic resonance imaging machine. Signal intensity changes for a region of interest (approximately 50 mm2) within the visual cortex during darkness and during 8-Hz patterned-flash visual stimulation. A conventional (spoiled grass) gradient echo technique (TE/TR, 30/50 mseconds; rf angle = 30) was used, sensitive to changes in the oxygenation state of hemoglobin.
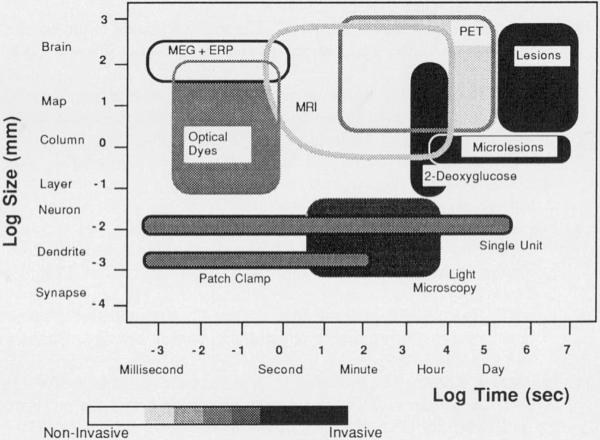
Spatial resolution, temporal resolution, and invasiveness of available techniques for the study of brain function (adapted from Churchland PS, Sejnowski TJ. Science 1988;242:741). Spatial resolving power is shown on the vertical axis and temporal resolution is plotted on the horizontal axis. Invasiveness, defined loosely as the risk of significant disruption of normal function or health of the subject, is plotted by gray shading. Dynamic magnetic resonance imaging (MRI) gathers functional information related to cerebral hemodynamics and is appropriate for the study of a variety of cognitive functions. MEG : magnetoencephalography; ERP : evoked response potential (electroencephalography); PET: positron emission tomography; 2-deoxyglucose : autoradiography.
References
-
- Zeki S, Shipp S. The functional logic of cortical connections. Nature. 1988;335:311–317. - PubMed
-
- Kosslyn SM. Aspects of a cognitive neuroscience of mental imagery. Science. 1988;240:1621–1626. - PubMed
-
- Born RT, Tootell RBH. Segregation of global and local motion processing in primate middle temporal visual area. Nature. 1992;357:497–499. - PubMed
-
- Churchland PS, Sejnowski TJ. Perspectives on cognitive neuroscience. Science. 1988;242:741–745. - PubMed
Publication types
MeSH terms
Substances
Grants and funding
LinkOut - more resources
Full Text Sources
Other Literature Sources
Medical