

Alcohol intoxication effects on visual perception: an fMRI study
- PMID: 14689506
- PMCID: PMC6871999
- DOI: 10.1002/hbm.10145
Alcohol intoxication effects on visual perception: an fMRI study
Erratum in
- Hum Brain Mapp. 2004 Apr;21(4):298-9
Abstract
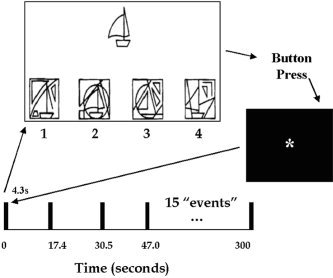
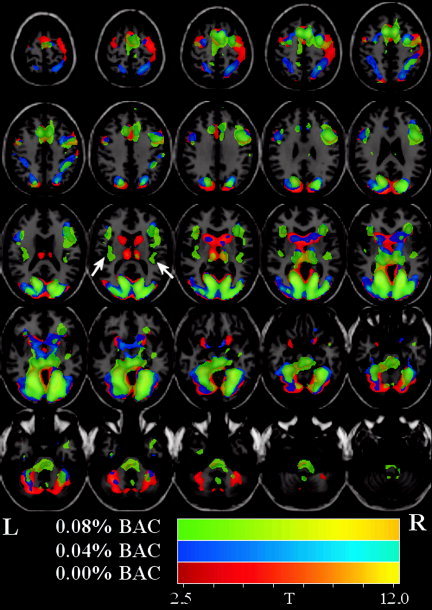
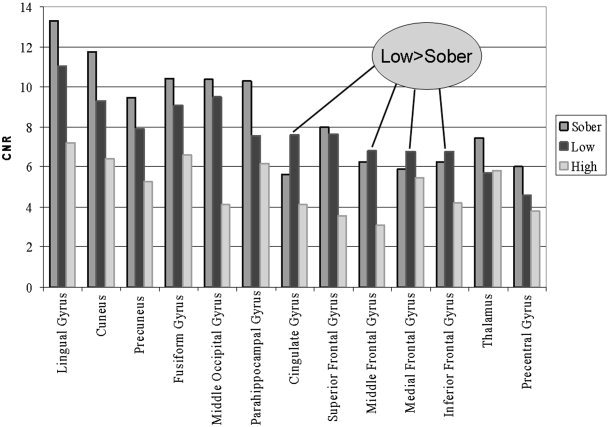
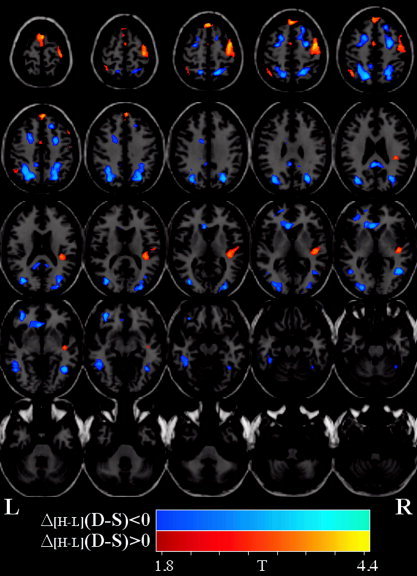
We examined the effects of two doses of alcohol (EtOH) on functional magnetic resonance imaging (fMRI) activation during a visual perception task. The Motor-Free Visual Perception Test-Revised (MVPT-R) provides measures of overall visual perceptual processing ability. It incorporates different cognitive elements including visual discrimination, spatial relationships, and mental rotation. We used the MVPT-R to study brain activation patterns in healthy controls (1) sober, and (2) at two doses of alcohol intoxication with event-related fMRI. The fMRI data were analyzed using a general linear model approach based upon a model of the time course and a hemodynamic response estimate. Additionally, a correlation analysis was performed to examine dose-dependent amplitude changes. With regard to alcohol-free task-related brain activation, we replicate our previous finding in which SPM group analysis revealed robust activation in visual and visual association areas, frontal eye field (FEF)/dorsolateral prefrontal cortex (DLPFC), and the supplemental motor area (SMA). Consistent with a previous study of EtOH and visual stimulation, EtOH resulted in a dose-dependent decrease in activation amplitude over much of the visual perception network and in a decrease in the maximum contrast-to-noise ratio (in the lingual gyrus). Despite only modest behavior changes (in the expected direction), significant dose-dependent activation increases were observed in insula, DLPFC, and precentral regions, whereas dose-dependent activation decreases were observed in anterior and posterior cingulate, precuneus, and middle frontal areas. Some areas (FEF/DLPFC/SMA) became more diffusely activated (i.e., increased in spatial extent) at the higher dose. Alcohol, thus, appears to have both global and local effects upon the neural correlates of the MVPT-R task, some of which are dose dependent.
Copyright 2003 Wiley-Liss, Inc.
Figures
Similar articles
-
fMRI activation in a visual-perception task: network of areas detected using the general linear model and independent components analysis.Neuroimage. 2001 Nov;14(5):1080-8. doi: 10.1006/nimg.2001.0921. Neuroimage. 2001. PMID: 11697939
-
Disruption of Frontal Lobe Neural Synchrony During Cognitive Control by Alcohol Intoxication.J Vis Exp. 2019 Feb 6;(144):10.3791/58839. doi: 10.3791/58839. J Vis Exp. 2019. PMID: 30799848 Free PMC article.
-
Functional imaging of cognitive control during acute alcohol intoxication.Alcohol Clin Exp Res. 2011 Jan;35(1):156-65. doi: 10.1111/j.1530-0277.2010.01332.x. Epub 2010 Oct 19. Alcohol Clin Exp Res. 2011. PMID: 20958334 Free PMC article.
-
Titrating Tipsy Targets: The Neurobiology of Low-Dose Alcohol.Trends Pharmacol Sci. 2017 Jun;38(6):556-568. doi: 10.1016/j.tips.2017.03.002. Epub 2017 Mar 31. Trends Pharmacol Sci. 2017. PMID: 28372826 Free PMC article. Review.
-
The effects of acute alcohol administration on the human brain: insights from neuroimaging.Neuropharmacology. 2014 Sep;84:101-10. doi: 10.1016/j.neuropharm.2013.07.039. Epub 2013 Aug 23. Neuropharmacology. 2014. PMID: 23978384 Free PMC article. Review.
Cited by
-
Compensatory neuroadaptation to binge drinking: Human evidence for allostasis.Addict Biol. 2021 May;26(3):e12960. doi: 10.1111/adb.12960. Epub 2020 Sep 4. Addict Biol. 2021. PMID: 32885571 Free PMC article.
-
A preliminary study on the effects of acute ethanol ingestion on default mode network and temporal fractal properties of the brain.MAGMA. 2014 Aug;27(4):291-301. doi: 10.1007/s10334-013-0420-5. Epub 2013 Nov 28. MAGMA. 2014. PMID: 24287715
-
Acute alcohol effects on attentional bias are mediated by subcortical areas associated with arousal and salience attribution.Neuropsychopharmacology. 2013 Jun;38(7):1365-73. doi: 10.1038/npp.2013.34. Epub 2013 Jan 29. Neuropsychopharmacology. 2013. PMID: 23361162 Free PMC article. Clinical Trial.
-
The effects of chronic alcohol self-administration in nonhuman primate brain networks.Alcohol Clin Exp Res. 2015 Apr;39(4):659-71. doi: 10.1111/acer.12688. Alcohol Clin Exp Res. 2015. PMID: 25833027 Free PMC article.
-
Reassessing Fitness-to-Drive in Drinker Drivers: The Role of Cognition and Personality.Int J Environ Res Public Health. 2021 Dec 5;18(23):12828. doi: 10.3390/ijerph182312828. Int J Environ Res Public Health. 2021. PMID: 34886553 Free PMC article.
References
-
- Ahveninen J, Jaaskelainen IP, Pekkonen E, Hallberg A, Hietanen M, Naatanen R, Sillanaukee P. (2000): Global field power of auditory n1 correlates with impaired verbal‐memory performance in human alcoholics. Neurosci Lett 285: 131–134. - PubMed
-
- Bylsma FW, Rebok GW, Gallo JJ. (1992): Cognitive and simulated driving performance in alzheimer's disease and normal aging. Clin Exp Neuro Psych 14: 17.
-
- Calhoun VD, Golay X, Pearlson GD. (2000): Improved FMRI slice timing correction: interpolation errors and wrap around effects. Denver, CO: Proc ISMRM.
-
- Calhoun VD, Adali T, McGinty V, Pekar JJ, Watson T, Pearlson GD. (2001): FMRI activation in a visual‐perception task: network of areas detected using the general linear model and independent components analysis. Neuroimage 14: 1080–1088. - PubMed
Publication types
MeSH terms
Substances
Grants and funding
LinkOut - more resources
Full Text Sources
Medical
