. 2004 Jan 15;324(2):153-69.
doi: 10.1016/j.ab.2003.09.039.

Radiative decay engineering 3. Surface plasmon-coupled directional emission

Affiliations

Radiative decay engineering 3. Surface plasmon-coupled directional emission

Joseph R Lakowicz. Anal Biochem. .

Abstract

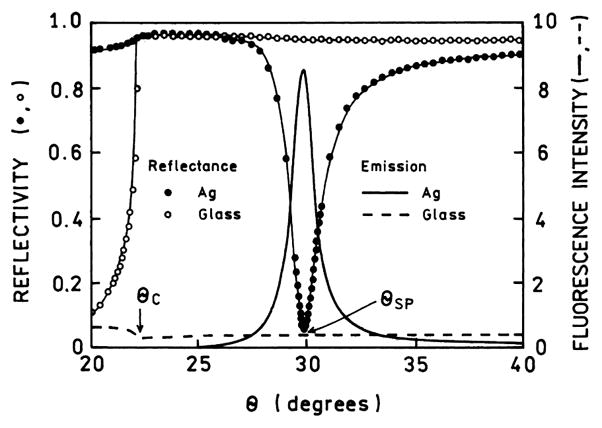
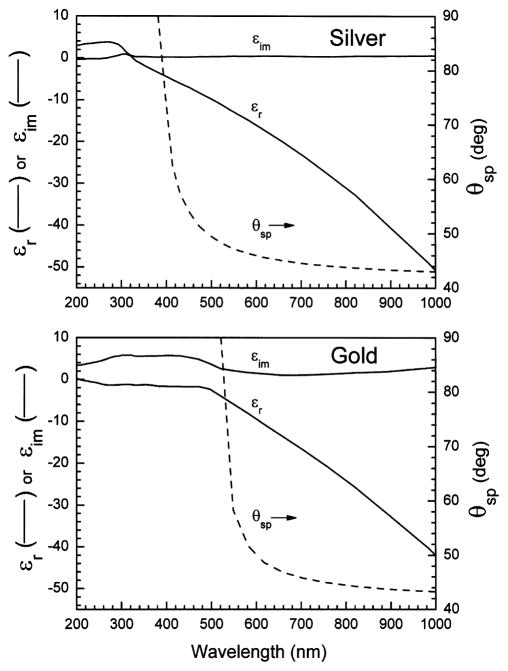
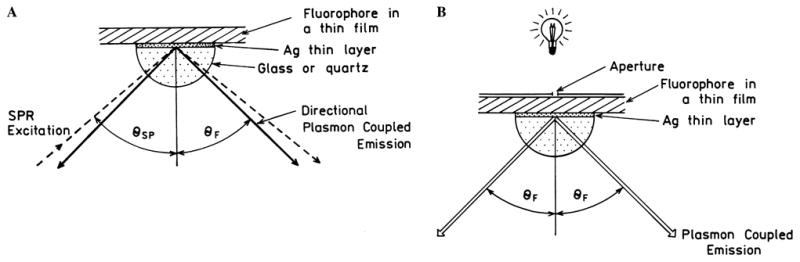
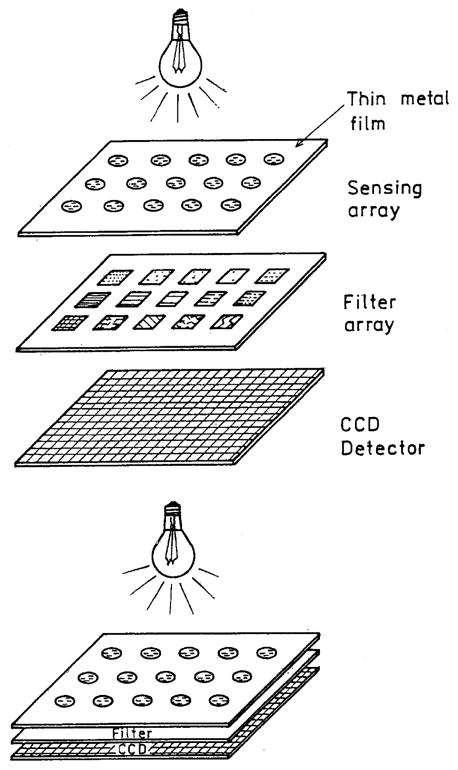
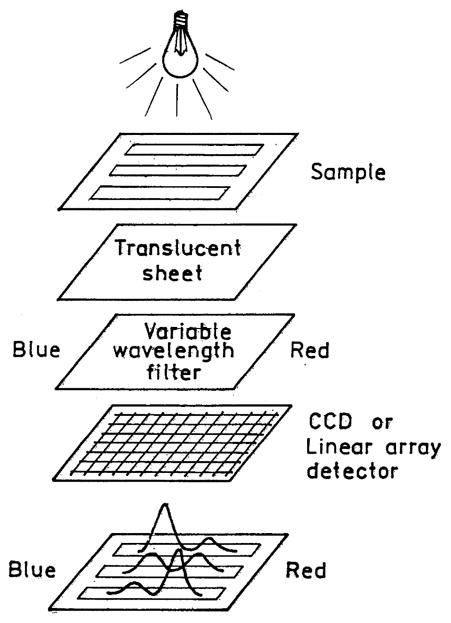
A new method of fluorescence detection that promises to increase sensitivity by 20- to 1000-fold is described. This method will also decrease the contribution of sample autofluorescence to the detected signal. The method depends on the coupling of excited fluorophores with the surface plasmon resonance present in thin metal films, typically silver and gold. The phenomenon of surface plasmon-coupled emission (SPCE) occurs for fluorophores 20-250 nm from the metal surface, allowing detection of fluorophores over substantial distances beyond the metal-sample interface. SPCE depends on interactions of the excited fluorophore with the metal surface. This interaction is independent of the mode of excitation; that is, it does not require evanescent wave or surface-plasmon excitation. In a sense, SPCE is the inverse process of the surface plasmon resonance absorption of thin metal films. Importantly, SPCE occurs over a narrow angular distribution, converting normally isotropic emission into easily collected directional emission. Up to 50% of the emission from unoriented samples can be collected, much larger than typical fluorescence collection efficiencies near 1% or less. SPCE is due only to fluorophores near the metal surface and may be regarded as emission from the induced surface plasmons. Autofluorescence from more distal parts of the sample is decreased due to decreased coupling. SPCE is highly polarized and autofluorescence can be further decreased by collecting only the polarized component or only the light propagating with the appropriate angle. Examples showing how simple optical configurations can be used in diagnostics, sensing, or biotechnology applications are presented. Surface plasmon-coupled emission is likely to find widespread applications throughout the biosciences.


Figures

Fig. 1
Fig. 1
Typical configuration for surface plasmon resonance analysis. The incident beam is p-polarized.
Fig. 2
Fig. 2
SPR reflectivity curves for a 47-nm gold film on BK-7 glass. Illumination was at 633 nm. The gold film was progressively coated with 11-mercaptoundecanoic acid (MU), followed by biotinylated poly-lysine (PL), and then avidin. Adapted from [–39].
Fig. 3
Fig. 3
Reflectivity curves for bare glass and silver-coated glass, both spin-coated with a fluorophore in polyvinyl alcohol. Prism is LaSFN9 glass, 633 nm. Also shown is the fluorescence from the labeled PVA film on the glass and silver surfaces. Adapted from [41,42].
Fig. 4
Fig. 4
Calculated wavelength-dependent reflectivity for a 47-nm-thick gold film. From [47].
Fig. 5
Fig. 5
Surface plasmon resonance analysis of noncovalent and covalent binding of BSA to a dextran-coated gold surface. B, buffer; BSA, bovine serum albumin; NHS/EDC, covalent coupling reagents. 1 RU = 10−4 degrees. From [52].
Fig. 6
Fig. 6
Propagation of light from a high refractive index medium (nP) to a low refractive index medium n0. For n0 = 1, nP = 1.5, and θP = 30.0, the θ0 = 48.6°.
Fig. 7
Fig. 7
Complex dielectrical constants for silver and gold. Calculated from [–60].
Fig. 8
Fig. 8
Schematic showing propagation constants in a prism and a thin film.
Fig. 9
Fig. 9
Polarization definitions for light incident on a surface.
Fig. 10
Fig. 10
Surface plasmon-coupled emission. F is a fluorophore.
Fig. 11
Fig. 11
(A) Surface plasmon-coupled emission with excitation by the evanescent wave (Kretschmann configuration) and (B) from the side opposite the prism (reverse Kretschmann configuration).
Fig. 12
Fig. 12
Surface plasmon-coupled cone of emission for fluorophores near a metallic film.
Fig. 13
Fig. 13
Cone of SPCE as seen from its central z axis. (A) Wavelength distribution not drawn to scale. (B) p-polarization of SPCE.
Fig. 14
Fig. 14
Normalized decay rates for quenching (....), SPCE (—), and free-space emission (– – –); || and ⊥ refer to the dipole orientations relative to the metal surface. Normalization is relative to the free-space decay rate for each process. Calculated for 633 nm. Revised from [68].
Fig. 15
Fig. 15
Distance-dependent interactions of a fluorophore with a metallic surface. Revised from [68]. || and ⊥ refer to a dipole parallel to or perpendicular to the surface, respectively. Quenching (....), SPCE (—), and free-space emission (– – –) to 633 nm.
Fig. 16
Fig. 16
Early detection of surface plasmon-coupled emission. The vertical lines indicate emission observed on the photographic plates. From [77].
Fig. 17
Fig. 17
Probability of surface plasmon-coupled emission for a fluorophore above a silver film. From [76].
Fig. 18
Fig. 18
Suppression of background emission by observation of the plasmon-coupled emission.
Fig. 19
Fig. 19
Configuration for wavelength-ratiometric measurement using SPCE.
Fig. 20
Fig. 20
Collection of emission from an array using plasmon-coupled emission.
Fig. 21
Fig. 21
Proximity-focused spectrofluorometer using a variable-wavelength emission filter.
Fig. 22
Fig. 22
Prism spectrofluorometer using surface plasmon-coupled emission.
Fig. 23
Fig. 23
Emission wavelength separation with grating-coupled emission.
Fig. 24
Fig. 24
Potential geometries for efficient collection of SPCE.

References

    1. Gosling JP. A decade of development in immunoassay methodology. Cell. 1990;36:1408–1427. - PubMed
    1. Walker NJ. A technique whose time has come. Science. 2002;296:557–559. - PubMed
    1. White JC, Stryer L. Photostability studies of phycobiliprotein fluorescent labels. Anal Biochem. 1987;161:442–452. - PubMed
    1. Kronick MN. The use of phycobiliproteins as fluorescent labels in immunoassays. J Immunol Methods. 1986;92:1–13. - PubMed
    1. Daehne S, Resch-Genger U, Wolfbeis OS. Near-Infrared Dyes for High Technology Applications. Kluwer Academic Publishers; New York: 1998. p. 458.

Publication types

Substances

LinkOut - more resources