. 2004 Jan 15;324(2):170-82.
doi: 10.1016/j.ab.2003.09.036.

Radiative decay engineering 4. Experimental studies of surface plasmon-coupled directional emission

Affiliations

Radiative decay engineering 4. Experimental studies of surface plasmon-coupled directional emission

Ignacy Gryczynski et al. Anal Biochem. .

Abstract

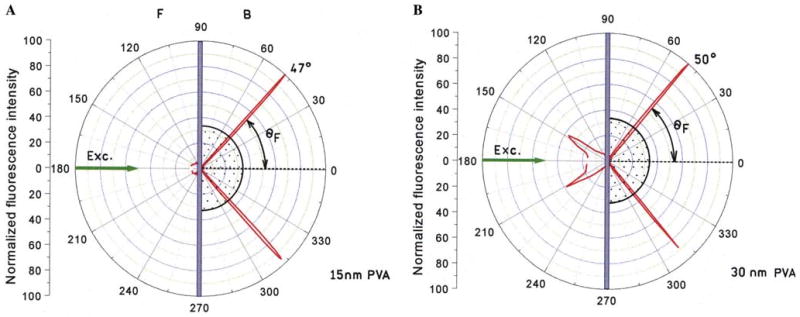
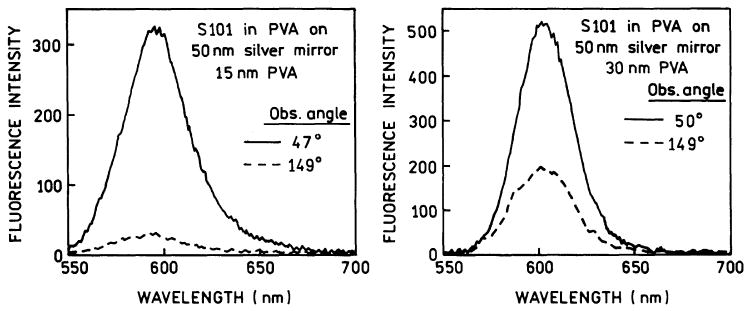
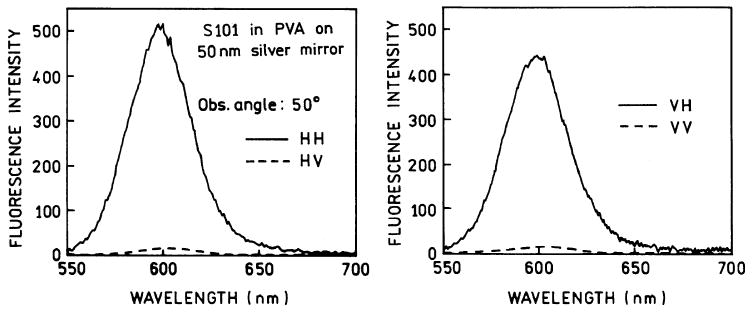
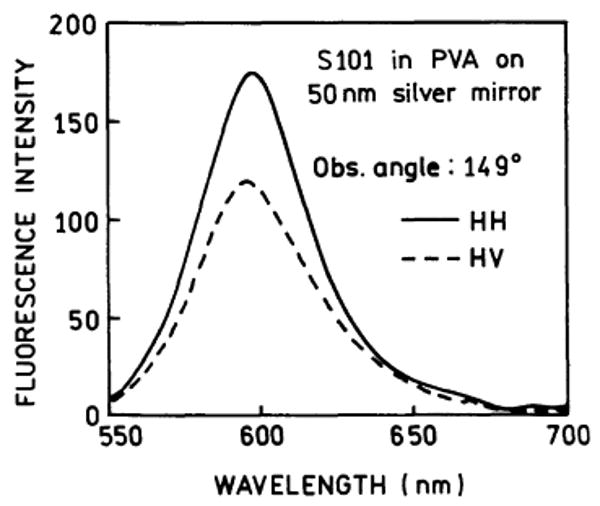
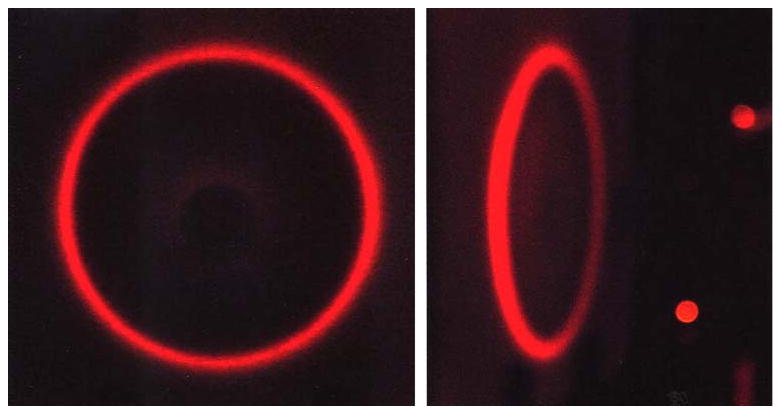
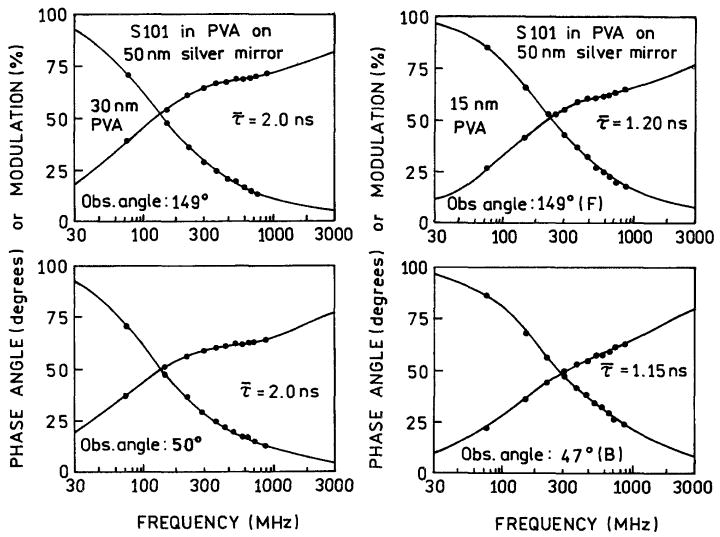
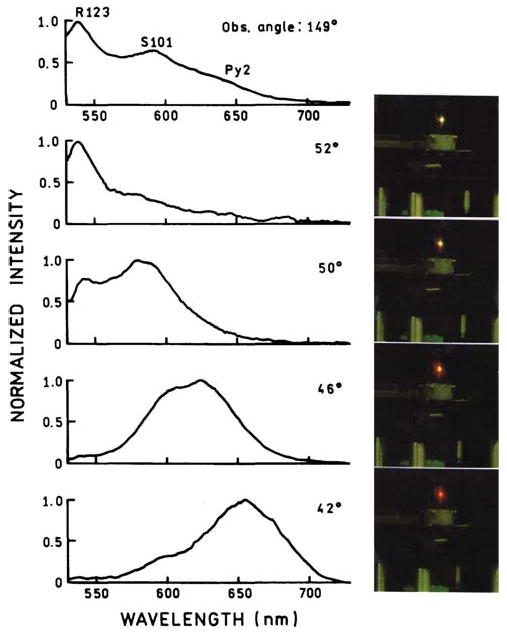
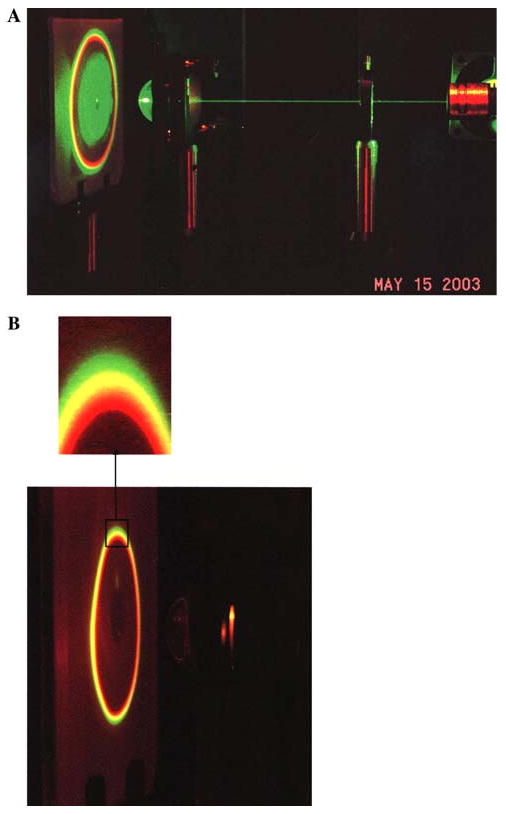
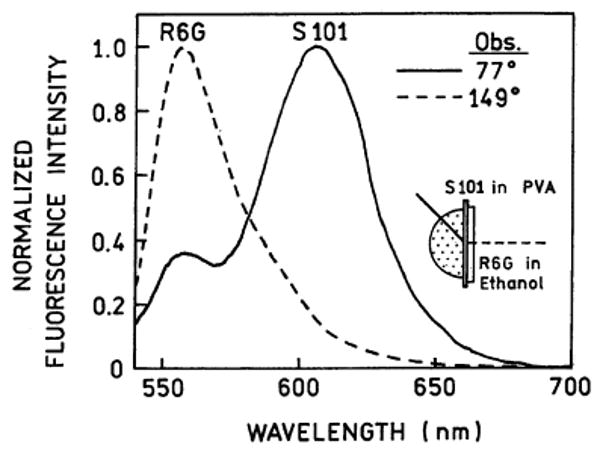
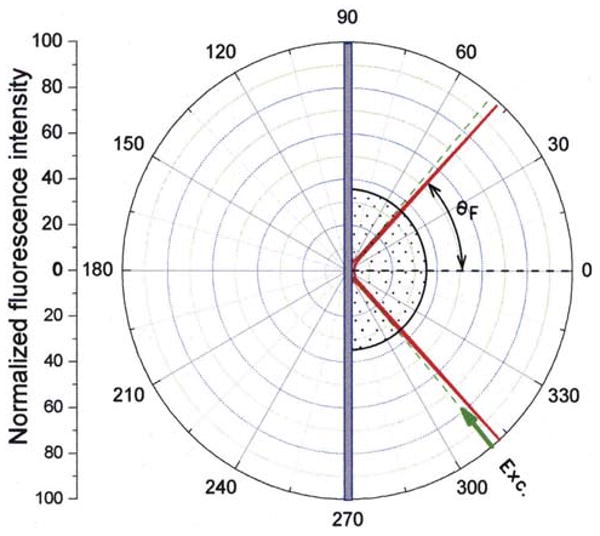
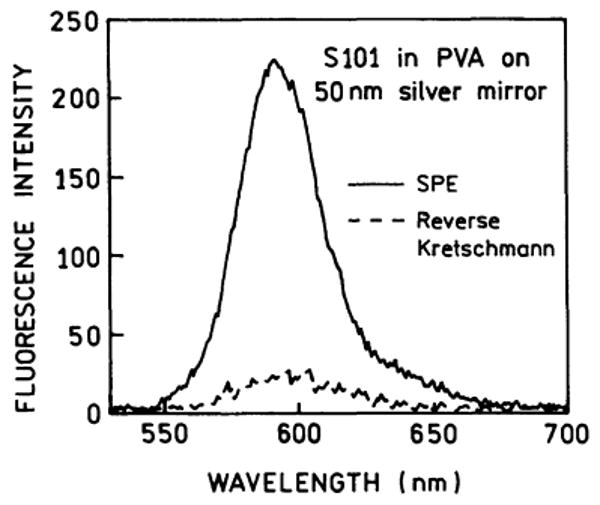
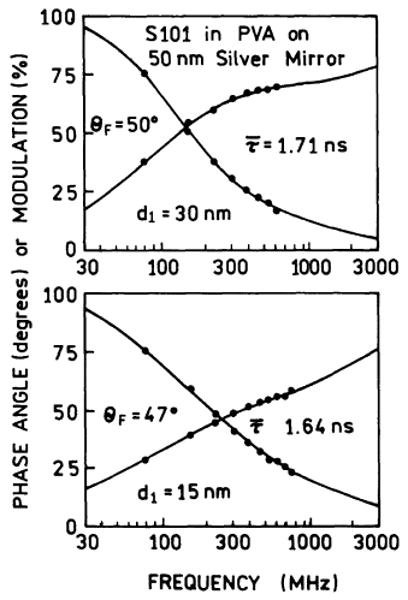
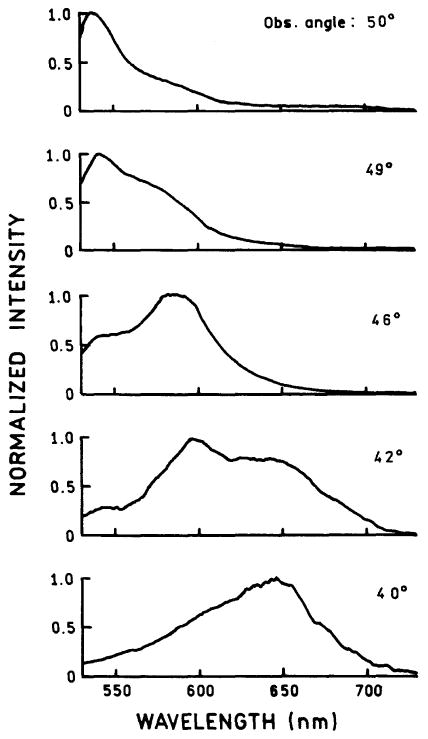
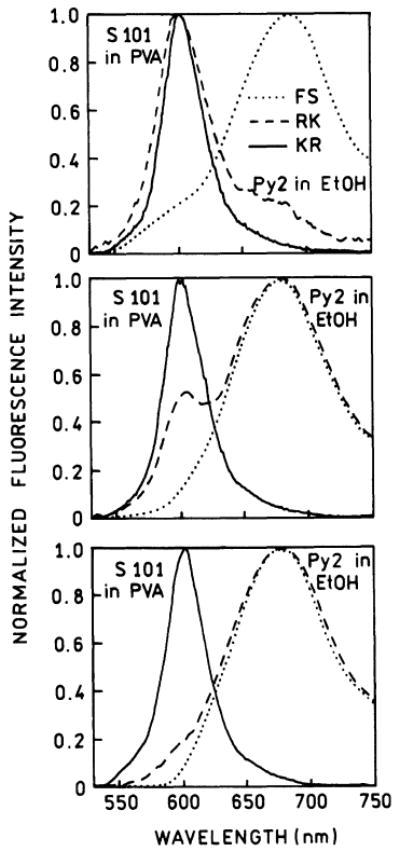
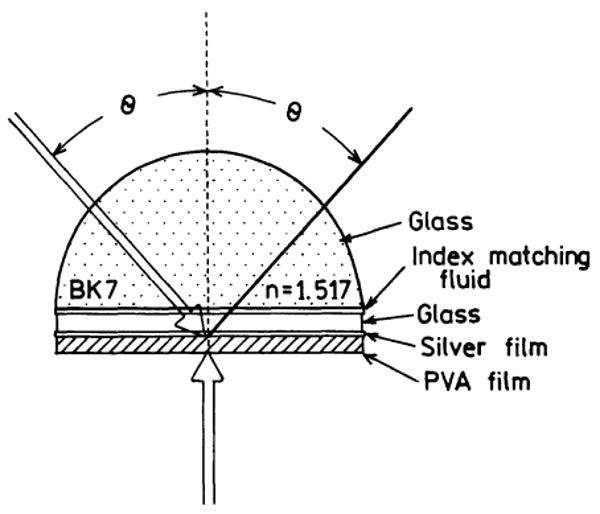
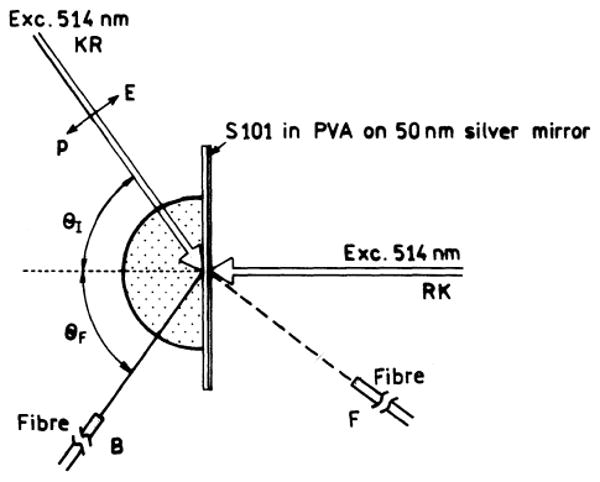
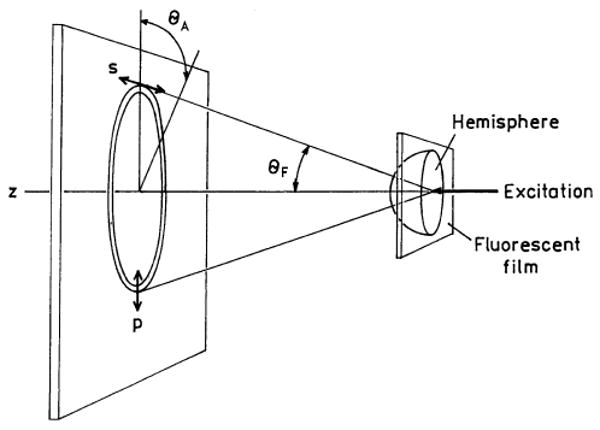
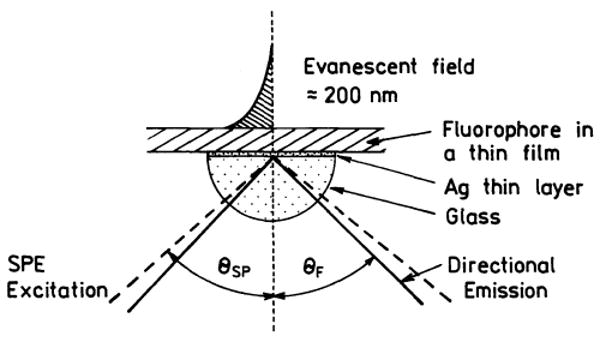
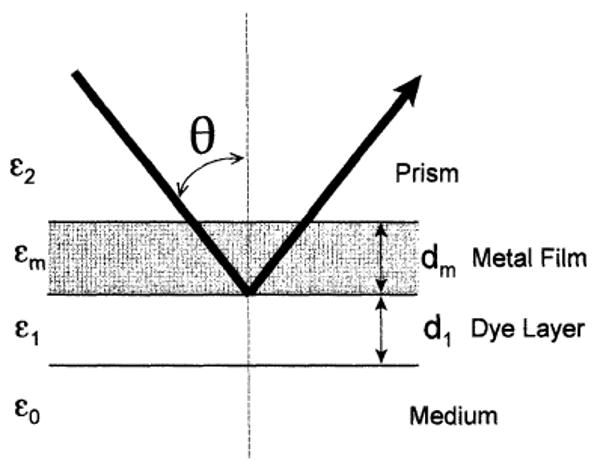
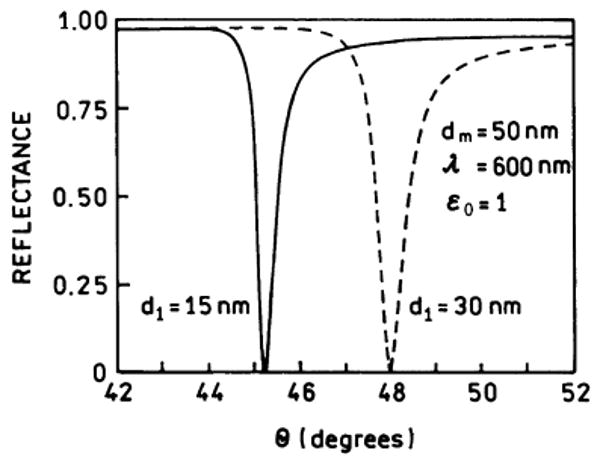
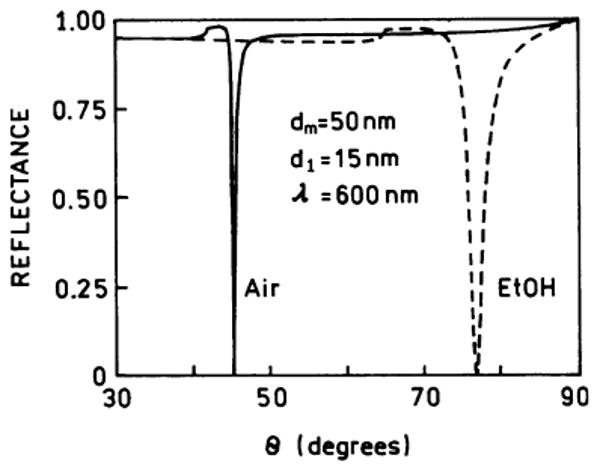
Fluorescence is typically isotropic in space and collected with low efficiency. In this paper we describe surface plasmon-coupled emission (SPCE), which displays unique optical properties and can be collected with an efficiency near 50%. SPCE occurs for fluorophores within about 200 nm of a thin metallic film, in our case a 50-nm-thick silver film on a glass substrate. We show that fluorophore proximity to this film converts the normally isotropic emission into highly directional emission through the glass substrate at a well-defined angle from the normal axis. Depending on the thickness of the polyvinyl alcohol (PVA) film on the silver, the coupling efficiency of sulforhodamine 101 in PVA ranged from 30 to 49%. Directional SPCE was observed whether the fluorophore was excited directly or by the evanescent field due to the surface plasmon resonance. The emission is always polarized perpendicular to the plane of incidence, irrespective of the polarization of the incident light. The lifetimes are not substantially changed, indicating a mechanism somewhat different from that observed previously for the effects of silver particles on fluorophores. Remarkably, the directional emission shows intrinsic spectral resolution because the coupling angles depend on wavelength. The distances over which SPCE occurs, 10 to 200 nm, are useful because a large number of fluorophores can be localized within this volume. The emission of more distant fluorophores does not couple into the glass, allowing background suppression from biological samples. SPCE can be expected to become rapidly useful in a variety of analytical and medical sensing applications.


Figures

Fig. 1
Fig. 1
Rotation stage and sample holder for directional excitation and emission measurements.
Fig. 2
Fig. 2
Angular distribution of S101 emission excited using the reverse Kretschmann configuration. The PVA thickness was approximately 15 nm (A) or 30 nm (B). The ratio of the angle-integrated intensities were IB/IF = 0.96 or 0.42, respectively.
Fig. 3
Fig. 3
Emission spectra of S101 in PVA. The spectra are for the SPCE (–––––) and the free-space emission (– – –) measured at the indicated angle.
Fig. 4
Fig. 4
Polarized emission spectra with polarized excitation for the 30-nm-thick sample.
Fig. 5
Fig. 5
Polarized emission spectra of the free-space emission of S101 in PVA, 30 nm thick.
Fig. 6
Fig. 6
Cone of emission for S101 in PVA observed with a hemi-spherical prism and RK excitation (Scheme 3). The emission was incident on tracing paper and photographed through a LWP 550 nm filter.
Fig. 7
Fig. 7
Frequency-domain intensity decays of S101 in PVA. Top, free-space emission. Bottom, surface plasmon-coupled emission.
Fig. 8
Fig. 8
Emission spectra and photographs of SPCE for a three-fluorophore mixture observed at different angles from the normal axis using the hemi-cylindrical prism. All concentrations of dyes in the evaporated films were about 10 mM.
Fig. 9
Fig. 9
Photograph of SPCE from the mixture of fluorophores using RK excitation and a hemi-spherical prism, 532 nm excitation. Top, no emission filter. Bottom, through a long-pass filter but no notch filter.
Fig. 10
Fig. 10
Emission spectra of S101 in PVA with simulated background emission from rhodamine 6G (R6G). The fiber was positioned near the sample and the slit was removed to collect the total emission. RK excitation, 30-nm-thick PVA. The concentration of S101 in the PVA film was about 10 mM and the concentration of R6G in ethanol was about 5 μM.
Fig. 11
Fig. 11
Angular distribution of the emission of S101 in 15-nm-thick PVA with Kretschmann excitation of θSP = 50°. The emission maximum was about 47°.
Fig. 12
Fig. 12
Comparison of the emission intensities of S101 in PVA with surface plasmon and reverse Kretschmann configurations.
Fig. 13
Fig. 13
Frequency-domain intensity decays of S101 with surface plasmon excitation.
Fig. 14
Fig. 14
Dependence of the emission spectra for the three component mixture (R123, S101, Py2) on the angle of observation. The angles are defined in Fig. 11.
Fig. 15
Fig. 15
Emission spectra and background rejection as seen with free-space (FS), reverse Kretschmann (RK), and Kretschmann (KR) SPCE. The “background” was Py2 in ethanol in a 1-mm-thick layer adjacent to the PVA film with S101. The concentrations of S101 in PVA was near 10 mM. The concentrations of Py2 in ethanol from top to bottom were 7.5, 15, and 30 μM.
Scheme 1
Scheme 1
Configuration of the hemi-cylinder and spin-coated slide.
Scheme 2
Scheme 2
Experimental geometry for measurement of free-space emission (F) and SPCE (B) with the Kretschmann (KR) and reverse Kretschmann (RK) configurations.
Scheme 3
Scheme 3
Cone of emission with a hemi-spherical prism.
Scheme 4
Scheme 4
Configuration of Kretschmann (KR) excitation. Not drawn to scale, the Ag film is 50 nm thick and the PVA film is 15 or 30 nm thick.
Figure A1
Figure A1
Schematic of a four-layer system with a metal film.
Figure A2
Figure A2
Calculated reflectivity curves for a four-layer system. For this calculation we use n2=ε2=1.50, dm = 50 nm, εm = −17 + 0:6i, and n0=ε0=1.0. The thickness d1 of the sample (PVA) was assumed to be 15 or 30 nm, with a refractive index n1=ε1=1.5.
Figure A3
Figure A3
Effect of replacing air (ε0 = 1.0) with ethanol (ε0 = 1.847) on the reflectivity of a 50-nm silver film; εm = −17 + 0.6i and ε2 = 2.25.

Similar articles

Cited by

References

    1. Diamandis EP. Immunoassays with time-resolved fluorescence spectroscopy: principles and applications. Clin Biochem. 1988;21:139–150. - PubMed
    1. Lövgren T, Pettersson K. Time-resolved fluoroimmunoassay, advantages and limitations. In: Van Dyke K, Van Dyke R, editors. Luminescence Immunoassay and Molecular Applications. CRC Press; New York: 1990. pp. 234–250.
    1. White JC, Stryer L. Photostability studies of phycobiliprotein fluorescent labels. Anal Biochem. 1987;161:442–452. - PubMed
    1. Kronick MN. The use of phycobiliproteins as fluorescent labels in immunoassays. J Immunol Methods. 1986;92:1–13. - PubMed
    1. Ambrose WP, Goodwin PM, Jett JH, Van Orden A, Wemer JH, Keller RA. Single molecule fluorescence spectroscopy at ambient temperature. Chem Rev. 1999;99:2929–2956. - PubMed

Publication types

MeSH terms