. 2003 Dec 22;163(6):1397-407.
doi: 10.1083/jcb.200302023.

Autocrine laminin-5 ligates alpha6beta4 integrin and activates RAC and NFkappaB to mediate anchorage-independent survival of mammary tumors

Affiliations

Autocrine laminin-5 ligates alpha6beta4 integrin and activates RAC and NFkappaB to mediate anchorage-independent survival of mammary tumors

Nastaran Zahir et al. J Cell Biol. .

Abstract

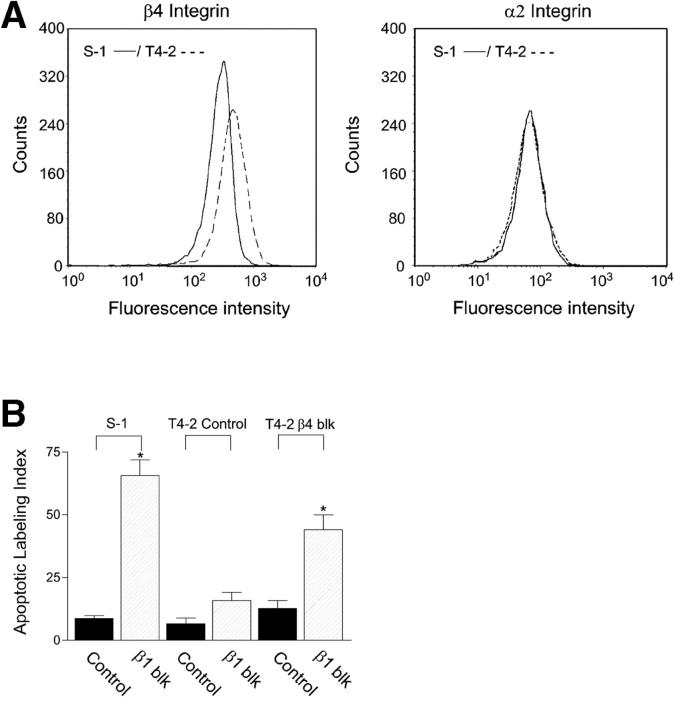
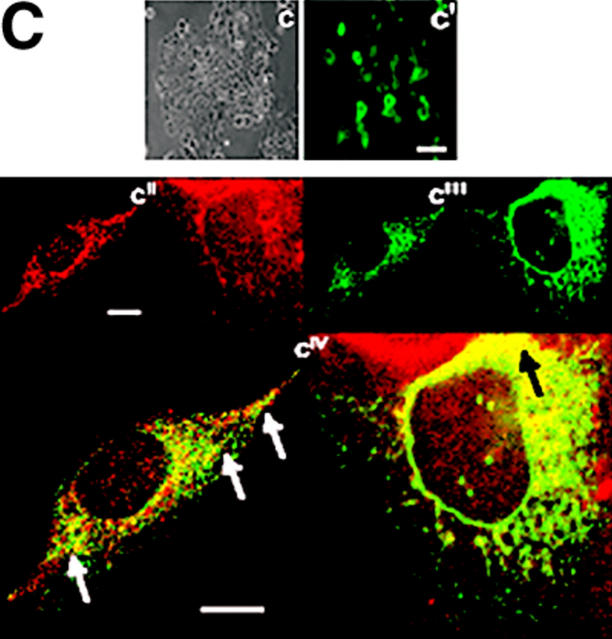
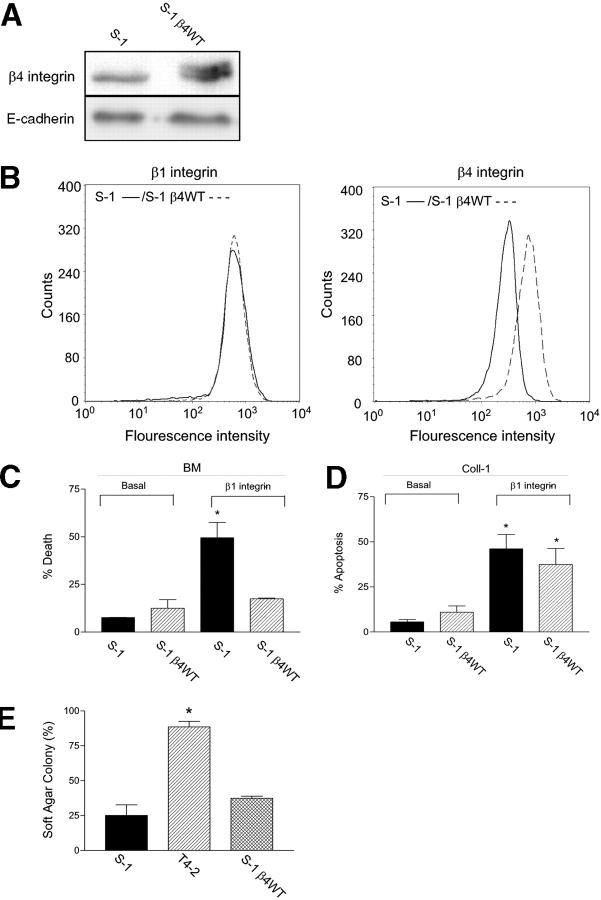
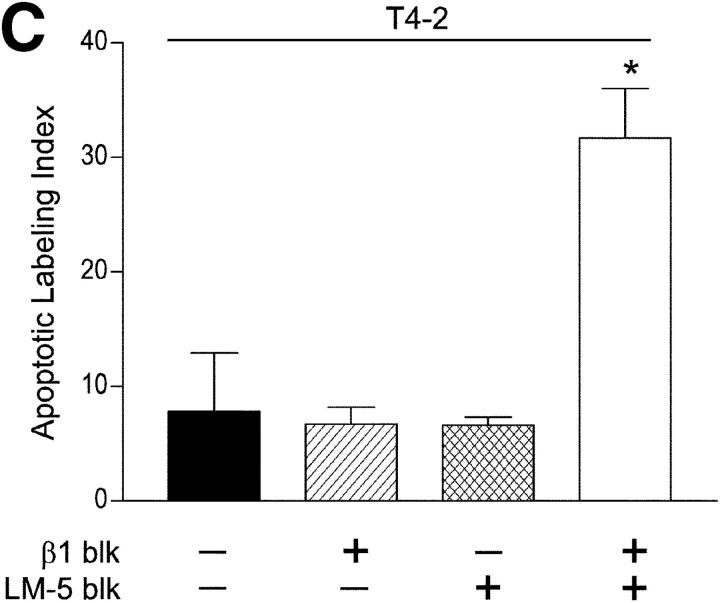
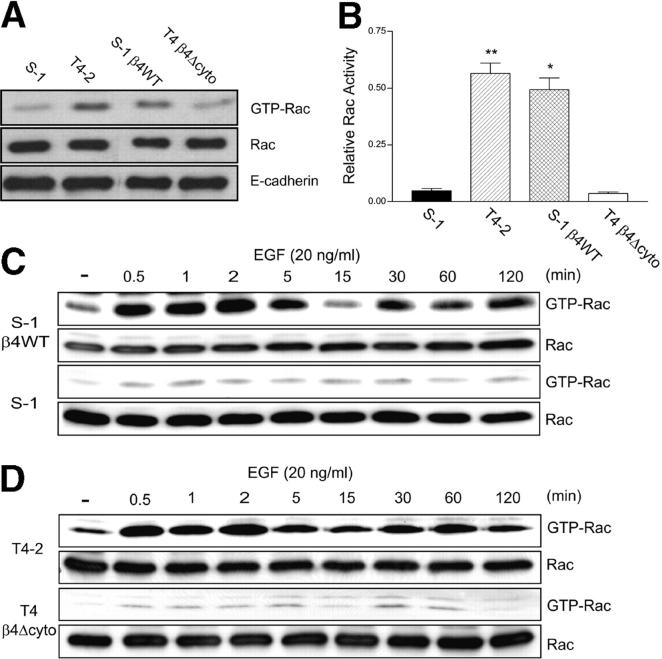
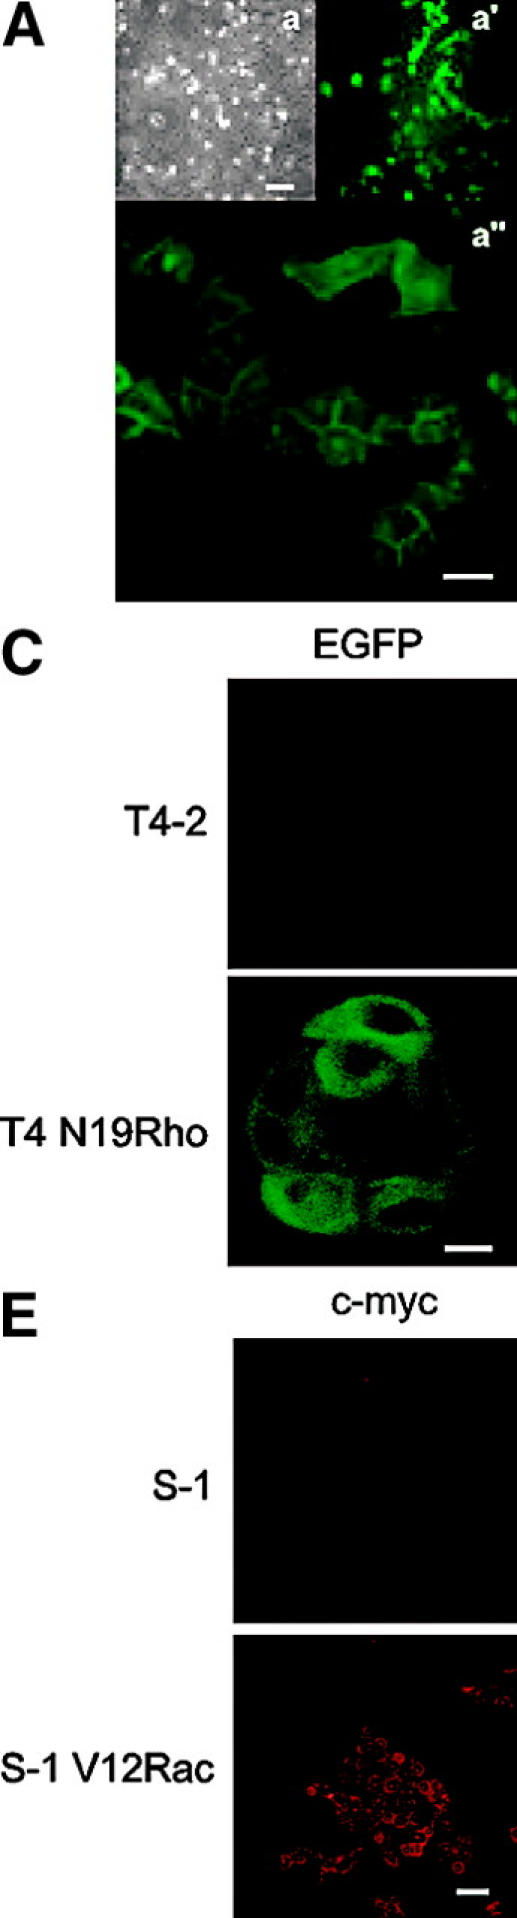
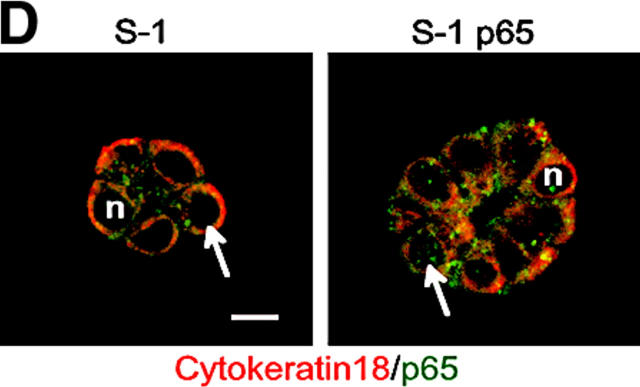
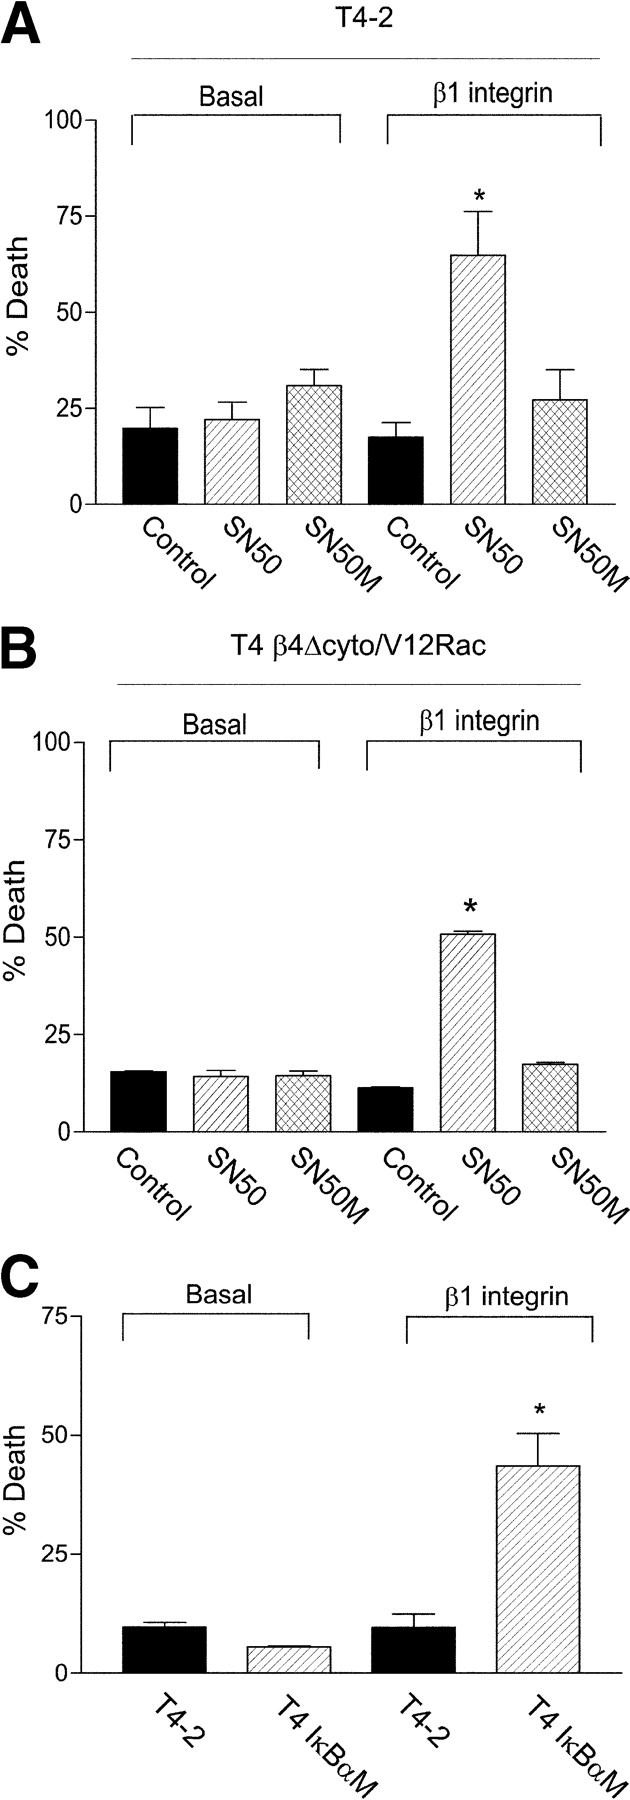
Invasive carcinomas survive and evade apoptosis despite the absence of an exogenous basement membrane. How epithelial tumors acquire anchorage independence for survival remains poorly defined. Epithelial tumors often secrete abundant amounts of the extracellular matrix protein laminin 5 (LM-5) and frequently express alpha6beta4 integrin. Here, we show that autocrine LM-5 mediates anchorage-independent survival in breast tumors through ligation of a wild-type, but not a cytoplasmic tail-truncated alpha6beta4 integrin. alpha6beta4 integrin does not mediate tumor survival through activation of ERK or AKT. Instead, the cytoplasmic tail of beta4 integrin is necessary for basal and epidermal growth factor-induced RAC activity, and RAC mediates tumor survival. Indeed, a constitutively active RAC sustains the viability of mammary tumors lacking functional beta1 and beta4 integrin through activation of NFkappaB, and overexpression of NFkappaB p65 mediates anchorage-independent survival of nonmalignant mammary epithelial cells. Therefore, epithelial tumors could survive in the absence of exogenous basement membrane through autocrine LM-5-alpha6beta4 integrin-RAC-NFkappaB signaling.


Figures

Figure 1.
Figure 1.
α6β4 integrin mediates anchorage-independent survival of mammary tumors. (A) FACS® analysis of cell surface integrin levels showing increased β4 integrin in the T4-2s compared with S-1s (S-1, 265 vs. T4-2, 430) and similar amounts of α2 integrin. (B) Apoptotic labeling indices were calculated using the TUNEL assay in S-1s and T4-2s grown in rBM for 96 h in the presence of function-blocking mAb against β1 integrin (AIIB2) and/or β4 integrin (ASC-3). Results are the mean ± SEM of at least three separate experiments. (C) Phase-contrast (c), conventional immunofluorescence (EGFP; c′) and confocal Immunofluorescence microscopy of α6 integrin (Texas red; c′′), β4 integrin (EGFP; c′′′), and α6 and β4 integrin overlay (yellow; cIV, as indicated by white and black arrows) showing uniform inducible expression of tailless EGFP β4 integrin (T4 β4Δcyto) in T4-2s and clustering of α6/β4Δcyto integrin at membrane adhesion plaques. Bars: (c and c′) 50 μm; (c′′–cIV) 20 μm. (D) Relative cell adhesion levels calculated using a fluorescence assay of control T4-2s (T4-2), and T4 β4Δcyto cells showing comparable adhesion to rBM and LM-5 in both cell types. (E) FACS® analysis showing similar levels of the LM integrins β1, β4, α3, and α6 in T4-2 and T4 β4Δcyto cells. (F) Cell viability was calculated using the Live/Dead assay for T4-2 or T4 β4Δcyto cells grown in rBM for 96 h with or without a function-blocking mAb to β1 integrin. (G) Soft agar assay results demonstrating that expression of the tailless β4 integrin (T4 β4Δcyto) inhibits anchorage-independent growth of T4-2s, so that infected cells behave like S-1 nonmalignant cells (S-1). Results for B, D, F, and G are the mean ± SEM of three to four separate experiments. (B and F) *, P ≤ 0.05. (G) **, P ≤ 0.01.
Figure 1.
Figure 1.
α6β4 integrin mediates anchorage-independent survival of mammary tumors. (A) FACS® analysis of cell surface integrin levels showing increased β4 integrin in the T4-2s compared with S-1s (S-1, 265 vs. T4-2, 430) and similar amounts of α2 integrin. (B) Apoptotic labeling indices were calculated using the TUNEL assay in S-1s and T4-2s grown in rBM for 96 h in the presence of function-blocking mAb against β1 integrin (AIIB2) and/or β4 integrin (ASC-3). Results are the mean ± SEM of at least three separate experiments. (C) Phase-contrast (c), conventional immunofluorescence (EGFP; c′) and confocal Immunofluorescence microscopy of α6 integrin (Texas red; c′′), β4 integrin (EGFP; c′′′), and α6 and β4 integrin overlay (yellow; cIV, as indicated by white and black arrows) showing uniform inducible expression of tailless EGFP β4 integrin (T4 β4Δcyto) in T4-2s and clustering of α6/β4Δcyto integrin at membrane adhesion plaques. Bars: (c and c′) 50 μm; (c′′–cIV) 20 μm. (D) Relative cell adhesion levels calculated using a fluorescence assay of control T4-2s (T4-2), and T4 β4Δcyto cells showing comparable adhesion to rBM and LM-5 in both cell types. (E) FACS® analysis showing similar levels of the LM integrins β1, β4, α3, and α6 in T4-2 and T4 β4Δcyto cells. (F) Cell viability was calculated using the Live/Dead assay for T4-2 or T4 β4Δcyto cells grown in rBM for 96 h with or without a function-blocking mAb to β1 integrin. (G) Soft agar assay results demonstrating that expression of the tailless β4 integrin (T4 β4Δcyto) inhibits anchorage-independent growth of T4-2s, so that infected cells behave like S-1 nonmalignant cells (S-1). Results for B, D, F, and G are the mean ± SEM of three to four separate experiments. (B and F) *, P ≤ 0.05. (G) **, P ≤ 0.01.
Figure 2.
Figure 2.
β4 integrin overexpression does not induce anchorage-independent growth and survival of nonmalignant MECs. (A) Immunoblot analysis of total RIPA lysates for S-1 controls (S-1) and S-1 cells overexpressing a full-length β4 integrin (S-1 β4WT) demonstrating increased expression of total β4 integrin in S-1 β4WT cells. (B) FACS® analysis of membrane β1 integrin and β4 integrin in S-1s and S-1 β4WT showing elevated β4 integrin expression in the infectants (S-1, 260 vs. S-1 β4WT, 650) and no effect on β1 integrin. (C) Cell viability was calculated using the Live/Dead assay for S-1 and S-1 β4WT grown in rBM for 96 h with and without a function-blocking mAb to β1 integrin. (D) Percent apoptosis was calculated by scoring the number of caspase 3–positive cells for S-1 and S-1 β4WT grown in collagen I for 96 h with and without function-blocking mAb to β1 integrin. (E) Soft agar assay results demonstrating that whereas malignant T4-2s exhibit anchorage independent growth and survival S-1s do not, even if they overexpress β4 integrin (S-1 β4WT). Results for C–E are the mean ± SEM of three to four separate experiments. *, P ≤ 0.05.
Figure 3.
Figure 3.
Autocrine LM-5 mediates anchorage-independent survival of mammary tumors. (A) Immunoblot analysis of total cell lysate and immunoprecipitants of secreted protein showing increased cellular β4 integrin and secreted LM-5 in the T4-2s compared with S-1s. Note that E-cadherin levels remain constant regardless of the state of cell transformation. (B) Confocal Immunofluorescence microscopy images of β4 integrin, LM-5, and collagen IV (Coll IV) in S-1 and T4-2 3D tissue structures. Data indicate that after malignant transformation, tumors have increased expression of cell surface β4 integrin and secrete more extracellular LM-5, whereas collagen IV deposition does not change appreciably. All cultures were analyzed after 10 d inside the rBM. Bar, 20 μm. (C) Apoptotic labeling indices calculated using the TUNEL assay in T4-2s grown in collagen I for 96 h in the presence or absence of function-blocking mAb against β1 integrin (AIIB2) and/or LM-5 (BM165). (D) Phase-contrast microscopy images of a representative T4-2 colony in soft agar (d) showing significant amounts of LM-5 deposition (d′; HRP) and specificity of staining in a parallel colony (d′′) treated without primary mAb (d′′′). Bar, 50 μm. (E) Percent apoptosis was calculated by scoring the number of caspase 3–positive S-1 and S-1 β4WT cells grown in collagen I for 96 h with or without 10 μg/ml of exogenous LM-5 and/or function-blocking mAb to β1 integrin. Results in C and E are the mean ± SEM of at least three separate experiments. *, P ≤ 0.05
Figure 3.
Figure 3.
Autocrine LM-5 mediates anchorage-independent survival of mammary tumors. (A) Immunoblot analysis of total cell lysate and immunoprecipitants of secreted protein showing increased cellular β4 integrin and secreted LM-5 in the T4-2s compared with S-1s. Note that E-cadherin levels remain constant regardless of the state of cell transformation. (B) Confocal Immunofluorescence microscopy images of β4 integrin, LM-5, and collagen IV (Coll IV) in S-1 and T4-2 3D tissue structures. Data indicate that after malignant transformation, tumors have increased expression of cell surface β4 integrin and secrete more extracellular LM-5, whereas collagen IV deposition does not change appreciably. All cultures were analyzed after 10 d inside the rBM. Bar, 20 μm. (C) Apoptotic labeling indices calculated using the TUNEL assay in T4-2s grown in collagen I for 96 h in the presence or absence of function-blocking mAb against β1 integrin (AIIB2) and/or LM-5 (BM165). (D) Phase-contrast microscopy images of a representative T4-2 colony in soft agar (d) showing significant amounts of LM-5 deposition (d′; HRP) and specificity of staining in a parallel colony (d′′) treated without primary mAb (d′′′). Bar, 50 μm. (E) Percent apoptosis was calculated by scoring the number of caspase 3–positive S-1 and S-1 β4WT cells grown in collagen I for 96 h with or without 10 μg/ml of exogenous LM-5 and/or function-blocking mAb to β1 integrin. Results in C and E are the mean ± SEM of at least three separate experiments. *, P ≤ 0.05
Figure 4.
Figure 4.
α6β4 integrin does not mediate anchorage-independent survival in mammary tumors via ERK or AKT. (A) Percent apoptosis calculated by scoring the number of caspase 3–positive T4-2s grown in rBM for 96 h with or without a function-blocking mAb to β1 integrin and treatment with 50 μM of the PI 3-kinase inhibitor LY 294002 (LY), 20 μM of the MEK inhibitor PD 98059 (PD), or vehicle (DMSO; Vehicle). (B) Immunoblot analysis of total and activated ERK and AKT in T4-2s grown in rBM with or without LY 294002 and/or PD 98059 treatment, was as described in A. (C) Percent apoptosis was calculated as described in A for T4-2 Vector control (Vector) and T4-2s expressing a dominant-negative AKT (DNAkt) grown in rBM for 96 h with or without a function-blocking mAb to β1 integrin and treatment with the MEK inhibitor PD 98059 (PD) as indicated. (D) Immunoblot analysis of HA expressed in control T4-2s (Vector) and T4-2s expressing a HA-tagged dominant-negative AKT (DNAkt). (E) Percent apoptosis calculated as in A for S-1 control (Vector) and S-1s expressing a dominant-negative AKT (DNAkt) grown in rBM for 96 h. Note that expression of the dominant-negative AKT decreased survival of S-1s yet failed to compromise the viability of the T4-2s, even when β1 integrin and ERK activity were inhibited. (F) Immunoblot analysis of HA in RIPA lysates of S-1 controls (Vector) and S-1s expressing an HA-tagged dominant-negative AKT (DNAkt). (G) Percent apoptosis was calculated as in A for S-1 vector control (Vector) and S-1s expressing a constitutively active myristoylated AKT (S1 MyrAkt) grown in rBM for 96 h with or without a function-blocking mAb to β1 integrin. Data indicate that although active AKT does significantly enhance anchorage-independent survival of nonmalignant MECs, it does not completely rescue S-1 viability. (H) Immunoblot analysis of HA in S-1 controls (Vector) or S-1s expressing an HA-tagged constitutively active myristoylated AKT (MyrAkt). All apoptosis data are the mean ± SEM of at least three separate experiments. **, P ≤ 0.01; ***, P ≤ 0.001.
Figure 5.
Figure 5.
α6β4 integrin regulates RAC activity in MECs. (A) Representative immunoblot of immunoprecipitated PAK-associated RAC (GTP-Rac), total cellular RAC (Rac) and total E-cadherin in S-1 control, T4-2 control, S-1s overexpressing β4 integrin (S-1 β4WT), and T4-2s expressing a tailless β4 integrin (T4 β4Δcyto). (B) Relative specific activity of RAC in S-1s, T4-2s, S-1 β4WT, and T4 β4Δcyto cells was calculated by densitometric analysis of immunoblots of activated (PAK-associated) RAC divided by total cellular RAC after normalization to total E-cadherin. Results are the mean ± SEM of three to five separate experiments. *, P ≤ 0.05; **, P ≤ 0.001. (C) Time course of EGF-induced RAC activation , detected as described in A, in S-1s and S-1 β4WT cells. Data show significantly enhanced EGF-induced RAC activation in S-1s expressing higher levels of ligated β4 integrin. (D) Time course of EGF-induced RAC activation, detected as described in A, in T4-2s and T4 β4Δcyto cells showing a significant reduction in EGF-induced RAC activation in T4-2s lacking the cytoplasmic tail of β4 integrin. Time course results show one representative experiment out of four.
Figure 6.
Figure 6.
RAC mediates anchorage-independent survival in MECs. (A) Phase-contrast (a) and immunofluorescence microscopy images (EGFP; a′ and a′′) of low (a and a′) and high (a′′) magnifications of EGFP-tagged N17 RAC showing uniform high expression of the stable, exogenously expressed dominant-negative RAC protein in T4-2s. Bars: (a and a′) 100 μm; and (a′′) 20 μm. (B) Cell viability calculated by the Live/Dead assay in control T4-2s (T4-2) and T4-2s expressing the N17 RAC (T4 N17Rac) grown in rBM for 96 h with or without a function-blocking mAb to β1 integrin. (C) Immunofluorescence microscopy images of EGFP (FITC) detected only in T4-2s stably expressing EGFP N19Rho. Bar, 20 μm. (D) Cell viability calculated by the Live/Dead assay in control T4-2s (T4-2) and T4-2s expressing the N19Rho (T4N19Rho) grown in rBM for 96 h with or without a function-blocking mAb to β1 integrin. (E) Immunofluorescence microscopy images of c-myc (Texas red) detected only in S-1s stably expressing a myc-tagged V12 RAC. Bar, 20 μm. (F) Cell viability calculated by the Live/Dead assay for S-1 controls (S-1) and S-1s expressing a c-myc–tagged V12 constitutively active RAC (S-1 V12Rac) grown in rBM for 96 h with or without a function-blocking mAb to β1 integrin. (G) Soft agar assay results demonstrating that expression of exogenous V12RAC (S-1 V12Rac) renders nonmalignant S-1s (S-1) anchorage independent for growth and survival. Results shown in B, D, F, and G are mean ± SEM of three experiments. *, P ≤ 0.05; **, P ≤ 0.01.
Figure 6.
Figure 6.
RAC mediates anchorage-independent survival in MECs. (A) Phase-contrast (a) and immunofluorescence microscopy images (EGFP; a′ and a′′) of low (a and a′) and high (a′′) magnifications of EGFP-tagged N17 RAC showing uniform high expression of the stable, exogenously expressed dominant-negative RAC protein in T4-2s. Bars: (a and a′) 100 μm; and (a′′) 20 μm. (B) Cell viability calculated by the Live/Dead assay in control T4-2s (T4-2) and T4-2s expressing the N17 RAC (T4 N17Rac) grown in rBM for 96 h with or without a function-blocking mAb to β1 integrin. (C) Immunofluorescence microscopy images of EGFP (FITC) detected only in T4-2s stably expressing EGFP N19Rho. Bar, 20 μm. (D) Cell viability calculated by the Live/Dead assay in control T4-2s (T4-2) and T4-2s expressing the N19Rho (T4N19Rho) grown in rBM for 96 h with or without a function-blocking mAb to β1 integrin. (E) Immunofluorescence microscopy images of c-myc (Texas red) detected only in S-1s stably expressing a myc-tagged V12 RAC. Bar, 20 μm. (F) Cell viability calculated by the Live/Dead assay for S-1 controls (S-1) and S-1s expressing a c-myc–tagged V12 constitutively active RAC (S-1 V12Rac) grown in rBM for 96 h with or without a function-blocking mAb to β1 integrin. (G) Soft agar assay results demonstrating that expression of exogenous V12RAC (S-1 V12Rac) renders nonmalignant S-1s (S-1) anchorage independent for growth and survival. Results shown in B, D, F, and G are mean ± SEM of three experiments. *, P ≤ 0.05; **, P ≤ 0.01.
Figure 7.
Figure 7.
β4 integrin activates NFκB via RAC to mediate anchorage-independent survival in mammary tumors. (A) Confocal immunofluorescence microscopy images of c-myc (Texas red) and NFκB p65 (FITC) of S-1 controls (S-1) and S-1 V12RAC expressing MECs (S-1 V12 Rac) grown in rBM for 8–10 d showing high levels of nuclear NFκB p65 in the S-1 V12 Rac MECs (arrows, nuclei as indicated by “n”) and low to nondetectable amounts in the control S-1s (arrows). Bar, 20 μm. (B) Quantification of 100–200 representative cells as shown in A, illustrating there is a significant increase in nuclear NFκB p65 when RAC activity is elevated. (C) Confocal immunofluorescence microscopy images of cytokeratin 18 (Texas red) and NFκB p65 (FITC) of T4-2 controls (T4-2) and T4-2 revertants (T4β1) grown in rBM for 12 d and treated with or without the Rho GTPase inhibitor Toxin A (C. difficile; 200 ng/ml). Note the presence of detectable nuclear p65 in the T4β1 cells (arrows) and its absence in the Toxin A–treated structures. Bar, 20 μm. (D) Quantification of 100–200 representative cells from similar images shown in C demonstrating high levels of nuclear NFκB p65 in T4β1 structures that decrease significantly after treatment with Toxin A. (E) Confocal immunofluorescence microscopy images of NFκB p65 (Texas red), EGFP protein (EGFP), and overlay of NFκB p65 and EGFP protein (yellow) in T4-2 controls (T4-2) and T4-2s expressing an EGFP-tagged tailless β4 integrin (T4 β4Δcyto). In the absence of a cytoplasmic β4 integrin tail, tumors fail to activate NFκB in response to TNF-α treatment, indicated by absence of staining in the nuclei (n) and presence of punctate staining in control nuclei (arrow). Bar, 20 μm. (F) Quantification of 100–200 representative cells from similar images as shown in E illustrating a significant increase in nuclear NFκB p65 only in T4-2s treated with TNF-α but not in T4Δβ4cyto cells. (G) Gel shift showing detectable binding of a transcriptional complex containing the NFκB p65 protein (supershift), its significant enhancement after TNF-α treatment in T4-2s, and its absence in T4-2s lacking the cytoplasmic tail of the β4 integrin (T4 β4Δcyto). (H) Cell viability calculated by the Live/Dead assay for T4 β4Δcyto cells and T4-2s expressing both the β4Δcyto and a constitutively active RAC (T4 β4Δcyto/V12Rac) grown in rBM for 96 h with and without a function-blocking mAb to β1 integrin. (I) Soft agar assay results demonstrating that expression of exogenous V12RAC supports anchorage-independent growth and survival of T4 β4Δcyto cells. Results from B, D, F, H, and I are the mean ± SEM of three to four experiments. *, P ≤ 0.05; **, P ≤ 0.01; and ***, P ≤ 0.001.
Figure 7.
Figure 7.
β4 integrin activates NFκB via RAC to mediate anchorage-independent survival in mammary tumors. (A) Confocal immunofluorescence microscopy images of c-myc (Texas red) and NFκB p65 (FITC) of S-1 controls (S-1) and S-1 V12RAC expressing MECs (S-1 V12 Rac) grown in rBM for 8–10 d showing high levels of nuclear NFκB p65 in the S-1 V12 Rac MECs (arrows, nuclei as indicated by “n”) and low to nondetectable amounts in the control S-1s (arrows). Bar, 20 μm. (B) Quantification of 100–200 representative cells as shown in A, illustrating there is a significant increase in nuclear NFκB p65 when RAC activity is elevated. (C) Confocal immunofluorescence microscopy images of cytokeratin 18 (Texas red) and NFκB p65 (FITC) of T4-2 controls (T4-2) and T4-2 revertants (T4β1) grown in rBM for 12 d and treated with or without the Rho GTPase inhibitor Toxin A (C. difficile; 200 ng/ml). Note the presence of detectable nuclear p65 in the T4β1 cells (arrows) and its absence in the Toxin A–treated structures. Bar, 20 μm. (D) Quantification of 100–200 representative cells from similar images shown in C demonstrating high levels of nuclear NFκB p65 in T4β1 structures that decrease significantly after treatment with Toxin A. (E) Confocal immunofluorescence microscopy images of NFκB p65 (Texas red), EGFP protein (EGFP), and overlay of NFκB p65 and EGFP protein (yellow) in T4-2 controls (T4-2) and T4-2s expressing an EGFP-tagged tailless β4 integrin (T4 β4Δcyto). In the absence of a cytoplasmic β4 integrin tail, tumors fail to activate NFκB in response to TNF-α treatment, indicated by absence of staining in the nuclei (n) and presence of punctate staining in control nuclei (arrow). Bar, 20 μm. (F) Quantification of 100–200 representative cells from similar images as shown in E illustrating a significant increase in nuclear NFκB p65 only in T4-2s treated with TNF-α but not in T4Δβ4cyto cells. (G) Gel shift showing detectable binding of a transcriptional complex containing the NFκB p65 protein (supershift), its significant enhancement after TNF-α treatment in T4-2s, and its absence in T4-2s lacking the cytoplasmic tail of the β4 integrin (T4 β4Δcyto). (H) Cell viability calculated by the Live/Dead assay for T4 β4Δcyto cells and T4-2s expressing both the β4Δcyto and a constitutively active RAC (T4 β4Δcyto/V12Rac) grown in rBM for 96 h with and without a function-blocking mAb to β1 integrin. (I) Soft agar assay results demonstrating that expression of exogenous V12RAC supports anchorage-independent growth and survival of T4 β4Δcyto cells. Results from B, D, F, H, and I are the mean ± SEM of three to four experiments. *, P ≤ 0.05; **, P ≤ 0.01; and ***, P ≤ 0.001.
Figure 8.
Figure 8.
NFκB activation is necessary and sufficient for anchorage-independent survival of MECs. (A and B) Cell viability was calculated using the Live/Dead assay for T4-2s (A) and T4 β4Δ cyto/V12RAC (B) MECs treated with either vehicle (Control), a peptide that inhibits nuclear translocation of NFκB SN50 (SN50), or a nonfunction-blocking peptide SN50M (SN50M) grown in rBM for 96 h with or without a function-blocking mAb to β1 integrin. (C) Cell viability calculated using the Live/Dead assay for T4-2 controls (T4-2) or T4-2s expressing a mutant IκBα (IκBαM) grown and treated as in A. (D) Confocal immunofluorescence microscopy images of Cytokeratin 18 (Texas red) and NFκB p65 (FITC) in S-1 controls (S-1) and S-1s overexpressing an exogenous NFκB p65 (S-1 p65) showing constitutive nuclear NFκB p65 in the S-1 p65 structures (arrows, nuclei as indicated by “n”). Bar, 20 μm. (E) Quantification of 100–200 representative cells assayed from images similar to D demonstrating a significant increase in nuclear NFκB p65 in S-1s overexpressing NFκB p65 (S-1 p65). (F) Cell viability was calculated using the Live/Dead assay for S-1 and S-1 cells overexpressing NFκB p65 (S-1 p65) grown and treated as described for A. (G) Soft agar assay results demonstrating overexpressing exogenous NFkB p65 (S-1 p65) permits S-1s (S-1) to form colonies in soft agar. Results for A–C and E–G are the mean ± SEM of three to five experiments. *, P ≤ 0.05; ***, P ≤ 0.001.
Figure 8.
Figure 8.
NFκB activation is necessary and sufficient for anchorage-independent survival of MECs. (A and B) Cell viability was calculated using the Live/Dead assay for T4-2s (A) and T4 β4Δ cyto/V12RAC (B) MECs treated with either vehicle (Control), a peptide that inhibits nuclear translocation of NFκB SN50 (SN50), or a nonfunction-blocking peptide SN50M (SN50M) grown in rBM for 96 h with or without a function-blocking mAb to β1 integrin. (C) Cell viability calculated using the Live/Dead assay for T4-2 controls (T4-2) or T4-2s expressing a mutant IκBα (IκBαM) grown and treated as in A. (D) Confocal immunofluorescence microscopy images of Cytokeratin 18 (Texas red) and NFκB p65 (FITC) in S-1 controls (S-1) and S-1s overexpressing an exogenous NFκB p65 (S-1 p65) showing constitutive nuclear NFκB p65 in the S-1 p65 structures (arrows, nuclei as indicated by “n”). Bar, 20 μm. (E) Quantification of 100–200 representative cells assayed from images similar to D demonstrating a significant increase in nuclear NFκB p65 in S-1s overexpressing NFκB p65 (S-1 p65). (F) Cell viability was calculated using the Live/Dead assay for S-1 and S-1 cells overexpressing NFκB p65 (S-1 p65) grown and treated as described for A. (G) Soft agar assay results demonstrating overexpressing exogenous NFkB p65 (S-1 p65) permits S-1s (S-1) to form colonies in soft agar. Results for A–C and E–G are the mean ± SEM of three to five experiments. *, P ≤ 0.05; ***, P ≤ 0.001.

References

    1. Bachelder, R.E., M.J. Ribick, A. Marchetti, R. Falcioni, S. Soddu, K.R. Davis, and A.M. Mercurio. 1999. p53 inhibits α6β4 integrin survival signaling by promoting the caspase 3–dependent cleavage of AKT/PKB. J. Cell Biol. 147:1063–1072. - PMC - PubMed
    1. Baldwin, A.S. 2001. Control of oncogenesis and cancer therapy resistance by the transcription factor NF-kappaB. J. Clin. Invest. 107:241–246. - PMC - PubMed
    1. Bouzahzah, B., C. Albanese, F. Ahmed, F. Pixley, M.P. Lisanti, J.D. Segall, J. Condeelis, D. Joyce, A. Minden, C.J. Der, et al. 2001. Rho family GTPases regulate mammary epithelium cell growth and metastasis through distinguishable pathways. Mol. Med. 7:816–830. - PMC - PubMed
    1. Bozinovski, S., J.E. Jones, R. Vlahos, J.A. Hamilton, and G.P. Anderson. 2002. Granulocyte/macrophage-colony-stimulating factor (GM-CSF) regulates lung innate immunity to lipopolysaccharide through Akt/Erk activation of NFkappa B and AP-1 in vivo. J. Biol. Chem. 277:42808–42814. - PubMed
    1. Cance, W.G., J.E. Harris, M.V. Iacocca, E. Roche, X. Yang, J. Chang, S. Simkins, and L. Xu. 2000. Immunohistochemical analyses of focal adhesion kinase expression in benign and malignant human breast and colon tissues: correlation with preinvasive and invasive phenotypes. Clin. Cancer Res. 6:2417–2423. - PubMed

Publication types

MeSH terms