Comparative Study
. 2004 Jan;13(1):166-76.
doi: 10.1110/ps.03120604.

Two different proteins that compete for binding to thrombin have opposite kinetic and thermodynamic profiles

Affiliations
Comparative Study

Two different proteins that compete for binding to thrombin have opposite kinetic and thermodynamic profiles

Abel Baerga-Ortiz et al. Protein Sci. 2004 Jan.

Abstract

Thrombin binds thrombomodulin (TM) at anion binding exosite 1, an allosteric site far from the thrombin active site. A monoclonal antibody (mAb) has been isolated that competes with TM for binding to thrombin. Complete binding kinetic and thermodynamic profiles for these two protein-protein interactions have been generated. Binding kinetics were measured by Biacore. Although both interactions have similar K(D)s, TM binding is rapid and reversible while binding of the mAb is slow and nearly irreversible. The enthalpic contribution to the DeltaG(bind) was measured by isothermal titration calorimetry and van't Hoff analysis. The contribution to the DeltaG(bind) from electrostatic steering was assessed from the dependence of the k(a) on ionic strength. Release of solvent H(2)O molecules from the interface was assessed by monitoring the decrease in amide solvent accessibility at the interface upon protein-protein binding. The mAb binding is enthalpy driven and has a slow k(d). TM binding appears to be entropy driven and has a fast k(a). The favorable entropy of the thrombin-TM interaction seems to be derived from electrostatic steering and a contribution from solvent release. The two interactions have remarkably different thermodynamic driving forces for competing reactions. The possibility that optimization of binding kinetics for a particular function may be reflected in different thermodynamic driving forces is discussed.


Figures
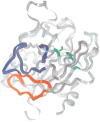
Figure 1.
Figure 1.
Comparison of the binding interfaces determined from H/2H exchange experiments for the interaction of thrombin with (A) the mAb, and with TMEGF45 as determined in Baerga-Ortiz et al. 2002. The mAb binds to thrombin at surface segments that were partially, but not totally solvent excluded by TMEGF45 (red). Two additional surface segments were completely solvent excluded by TMEGF45 but were not protected by the mAb (blue). The thrombin active site residues are colored green.
Figure 2.
Figure 2.
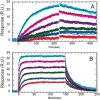
(A) Biacore sensorgrams for the binding at 298 K and 150 mM NaCl of thrombin to (A) mAb (300 RU) or (B) TMEGF456 (570 RU) immobilized on the sensor chip. The thrombin concentrations were 0.78 nM (red), 1.56 nM (blue), 3.12 nM (green), 6.25 nM (purple), 12.5 nM (pink), 25 nM (cyan). The data were globally fit to a 1 : 1 binding model (black lines in both).
Figure 3.
Figure 3.
Isothermal titration calorimetry of thrombin binding to either mAb or TMEGF45. (A) Raw data showing the heat released during binding of thrombin to mAb (black trace) and the heat of dilution control experiment (blue trace). (B) Integrated heat of binding for the thrombin–mAb interaction at 298 K. Data were fit to a single binding site model, assuming an effective concentration of binding sites for the antibody, after subtracting the heat of dilution data. Raw (C) and integrated (D) data for the thrombin–TMEGF45 interaction showing no heat change was observed during binding at 298 K.
Figure 4.
Figure 4.
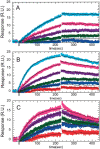
Biacore sensorgrams for the binding of mAb (300 RU immobilized) to thrombin at 150 mM NaCl and (A) 288 K or (B) 298 K or (C) 310 K. The thrombin concentrations are 0.78 nM (red), 1.56 nM (blue), 3.12 nM (green), 6.25 nM (purple), 12.5 nM (pink), and 25 nM (cyan). The data were globally fit to a 1 : 1 binding model (black lines). For the 288 K data set, no binding was observed at 0.78 nM, and for the 310 K data set, the binding at 25 nM was left out of the fit. The sensorgrams represent one of the two data sets used in the van’t Hoff analysis presented in Figure 5 ▶.
Figure 5.
Figure 5.
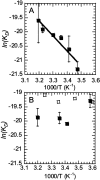
van’t Hoff plots for the temperature dependence of ln(KD) determined by Biacore for the (A) the thrombin–mAb interaction and (B) thrombin–TM interaction. The error bars on both plots are the standard deviation for two independent determinations of each KD. The open squares on the plot for the thrombin–TM interaction are the data obtained from binding competition experiments carried out previously (Vindigni et al. 1997). For the thrombin–mAb interaction, an estimate of ΔH was obtained from the slope of the line. The error bars are the standard deviation from two independent data sets, one of which is given in Table 1 and a part of which is shown in Figure 4 ▶. The data from the 279 K study of the thrombin–mAb interaction was not used in the final data analysis because the binding became so slow that global fitting of the data resulted in an overestimate of the Rmax (Table 1).
Figure 6.
Figure 6.
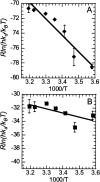
Eyring plots represent the temperature dependence of the kinetic constants (A) kd and (B) ka determined by Biacore for the thrombin–mAb interaction. The error bars on both plots are the standard deviation for two independent determinations of each kinetic constant.
Figure 7.
Figure 7.
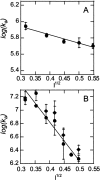
Ionic strength dependence of the ka is represented by Debye-Hückel plots for (A) the thrombin–mAb interaction and (B) the thrombin–TM interaction. The ionic strength was varied by changing the concentration of NaCl (circles) or (CH3)4NCl (diamonds). The error bars on both plots are the standard deviation for two independent determinations of each ka. The data plotted in Figure 7B ▶ are from previously published work (Baerga-Ortiz et al. 2000).
Figure 8.
Figure 8.
Time courses for the retention of deuterium at the interface regions of thrombin reveal areas with solvent inaccessible amides. (A) An example of the raw data used to calculate the number of amides from which interface H2O molecules were released. (B) Kinetic plots showing the retention of deuterium on amides within residues 139–149 of thrombin alone (filled squares) compared to thrombin bound to the mAb (filled circles). (C) Kinetic plots showing the retention of deuterium on amides within residues 54–61 of thrombin alone (filled squares) compared to thrombin bound to TM (filled circles). (D) Same as C, but for residues 97–117 of thrombin. Data were fit to biexponential or triexponential models as required.

References

    1. Baerga-Ortiz, A. 2002. “Energetics of the thrombin:thrombomodulin interaction.” Ph.D. thesis, University of California, San Diego.
    1. Baerga-Ortiz, A., Rezaie, A.R., and Komives, E.A. 2000. Electrostatic dependence of the thrombin–thrombomodulin interaction. J. Mol. Biol. 296 651–658. - PubMed
    1. Baerga-Ortiz, A., Hughes, C.A., Mandell, J.G., and Komives, E.A. 2002. Epitope mapping of a monoclonal antibody against human thrombin by H/D-exchange mass spectrometry reveals selection of a diverse sequence in a highly conserved protein. Protein Sci. 11 1300–1308. - PMC - PubMed
    1. Baker, B.M. and Murphy, K.P. 1997. Dissecting the energetics of a protein–protein interaction: The binding of ovomucoid third domain to elastase. J. Mol. Biol. 268 557–569. - PubMed
    1. Brady, G.P. and Sharp, K.A. 1997a. Energetics of cyclic dipeptide crystal packing and solvation. Biophys. J. 72 913–927. - PMC - PubMed

Publication types

MeSH terms

LinkOut - more resources