

Could CO(2)-induced land-cover feedbacks alter near-shore upwelling regimes?
- PMID: 14691256
- PMCID: PMC314132
- DOI: 10.1073/pnas.0305746101
Could CO(2)-induced land-cover feedbacks alter near-shore upwelling regimes?
Abstract
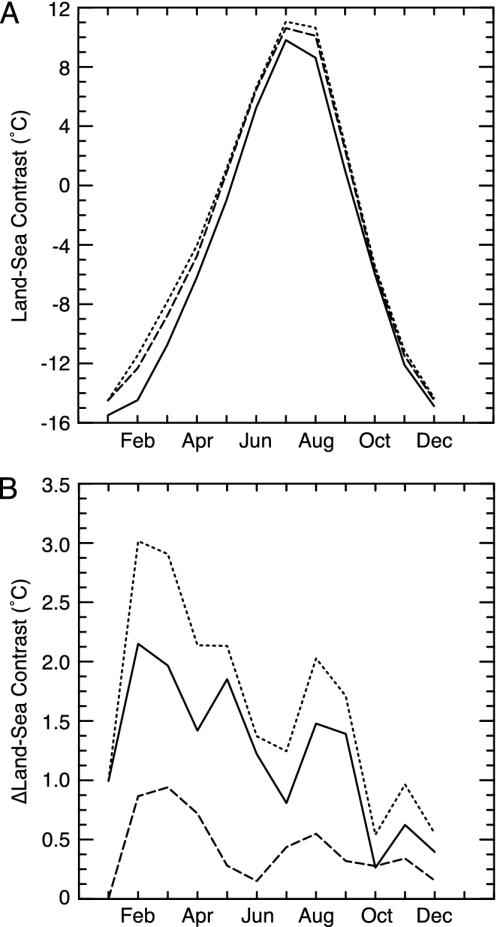
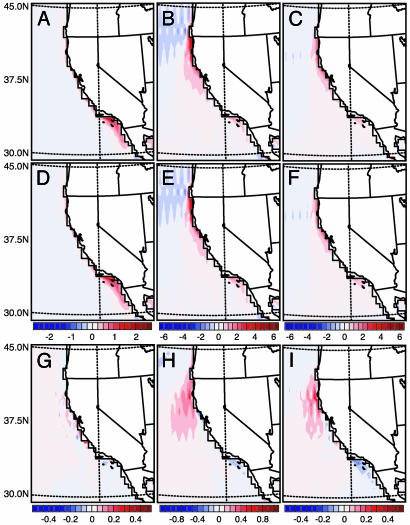
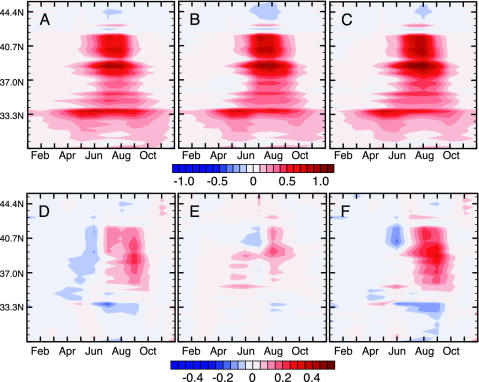
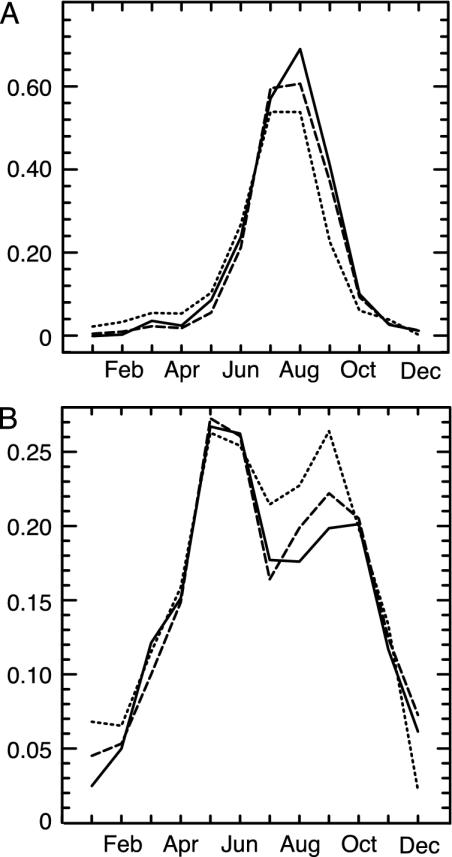
The response of marine and terrestrial environments to global changes in atmospheric carbon dioxide (CO(2)) concentrations will likely be governed by both responses to direct environmental forcing and responses to Earth-system feedbacks induced by that forcing. It has been proposed that anthropogenic greenhouse forcing will intensify coastal upwelling in eastern boundary current regions [Bakun, A. (1990) Science 247, 198-201]. Focusing on the California Current, we show that biophysical land-cover-atmosphere feedbacks induced by CO(2) radiative forcing enhance the radiative effects of CO(2) on land-sea thermal contrast, resulting in changes in eastern boundary current total seasonal upwelling and upwelling seasonality. Specifically, relative to CO(2) radiative forcing, land-cover-atmosphere feedbacks lead to a stronger increase in peak- and late-season near-shore upwelling in the northern limb of the California Current and a stronger decrease in peak- and late-season near-shore upwelling in the southern limb. Such changes will impact both marine and terrestrial communities [Bakun, A. (1990) Science 247, 198-201; Soto, C. G. (2001) Rev. Fish Biol. Fish. 11, 181-195; and Agostini, V. N. & Bakun, A. (2002) Fish. Oceanogr. 11, 129-142], and these and other Earth-system feedbacks should be expected to play a substantial role in shaping the response of eastern boundary current regions to CO(2) radiative forcing.
Figures
Similar articles
-
Chapter 1. Impacts of the oceans on climate change.Adv Mar Biol. 2009;56:1-150. doi: 10.1016/S0065-2881(09)56001-4. Adv Mar Biol. 2009. PMID: 19895974
-
Indirect radiative forcing of climate change through ozone effects on the land-carbon sink.Nature. 2007 Aug 16;448(7155):791-4. doi: 10.1038/nature06059. Epub 2007 Jul 25. Nature. 2007. PMID: 17653194
-
How will Somali coastal upwelling evolve under future warming scenarios?Sci Rep. 2016 Jul 21;6:30137. doi: 10.1038/srep30137. Sci Rep. 2016. PMID: 27440455 Free PMC article.
-
Trace metals in Antarctica related to climate change and increasing human impact.Rev Environ Contam Toxicol. 2000;166:129-73. Rev Environ Contam Toxicol. 2000. PMID: 10868078 Review.
-
Forests and climate change: forcings, feedbacks, and the climate benefits of forests.Science. 2008 Jun 13;320(5882):1444-9. doi: 10.1126/science.1155121. Science. 2008. PMID: 18556546 Review.
Cited by
-
Effect of elevated pCO2 on metabolic responses of porcelain crab (Petrolisthes cinctipes) Larvae exposed to subsequent salinity stress.PLoS One. 2014 Oct 8;9(10):e109167. doi: 10.1371/journal.pone.0109167. eCollection 2014. PLoS One. 2014. PMID: 25295878 Free PMC article.
-
A review on factors influencing fog formation, classification, forecasting, detection and impacts.Rend Lincei Sci Fis Nat. 2022;33(2):319-353. doi: 10.1007/s12210-022-01060-1. Epub 2022 Mar 14. Rend Lincei Sci Fis Nat. 2022. PMID: 35309246 Free PMC article. Review.
-
Climate change and decadal shifts in the phenology of larval fishes in the California Current ecosystem.Proc Natl Acad Sci U S A. 2015 Jul 28;112(30):E4065-74. doi: 10.1073/pnas.1421946112. Epub 2015 Jul 9. Proc Natl Acad Sci U S A. 2015. PMID: 26159416 Free PMC article.
-
Life at the edge: an experimental study of a poleward range boundary.Oecologia. 2006 Jun;148(2):270-9. doi: 10.1007/s00442-006-0372-9. Epub 2006 Feb 14. Oecologia. 2006. PMID: 16477473
-
Potential responses to climate change in organisms with complex life histories: evolution and plasticity in Pacific salmon.Evol Appl. 2008 May;1(2):252-70. doi: 10.1111/j.1752-4571.2008.00033.x. Evol Appl. 2008. PMID: 25567630 Free PMC article.
References
-
- Bakun, A. & Nelson, C. S. (1991) J. Phys. Oceanogr. 21, 1815–1834.
-
- Bakun, A. (1990) Science 247, 198–201. - PubMed
-
- Schwing, F. B. & Mendelssohn, R. (1997) J. Geophys. Res. Oceans 102, 3421–3438.
-
- Mote, P. W. & Mantua, N. J. (2002) Geophys. Res. Lett. 29, 2138.
-
- Snyder, M. A., Sloan, L. C., Diffenbaugh, N. S. & Bell, J. L. (2003) Geophys. Res. Lett., 10.1029/2003GL017647.
LinkOut - more resources
Full Text Sources
