. 2003 Dec;1(3):E60.
doi: 10.1371/journal.pbio.0000060. Epub 2003 Oct 13.

Identification of Drosophila MicroRNA targets

Affiliations

Identification of Drosophila MicroRNA targets

Alexander Stark et al. PLoS Biol. 2003 Dec.

Abstract

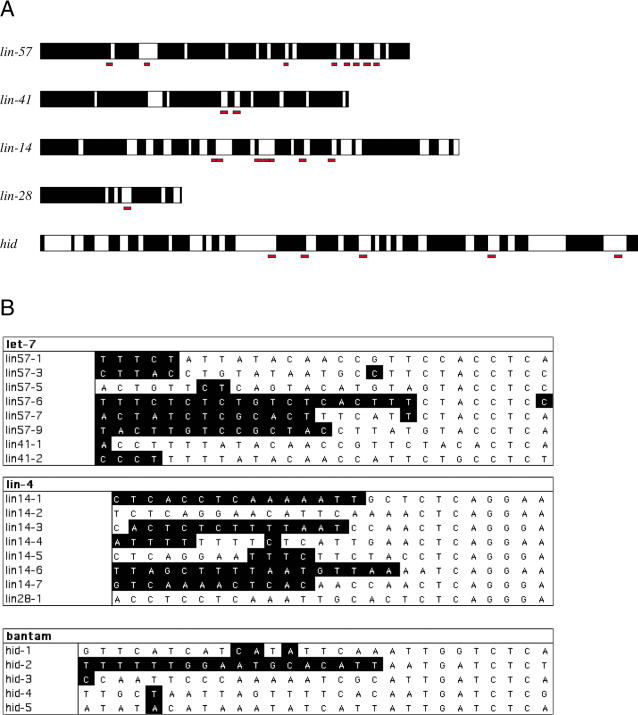
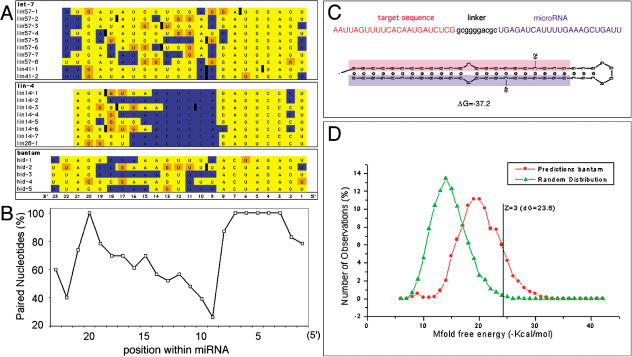
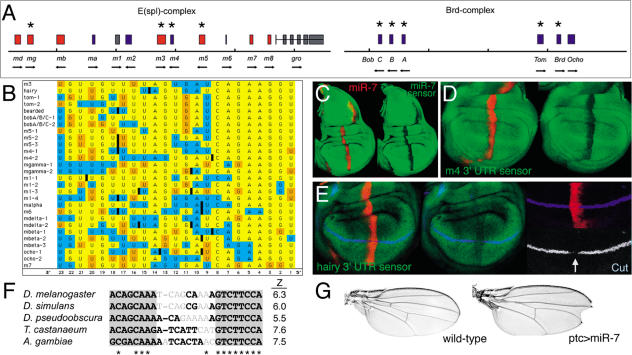
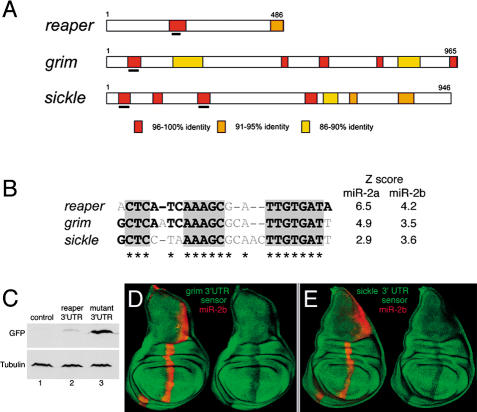
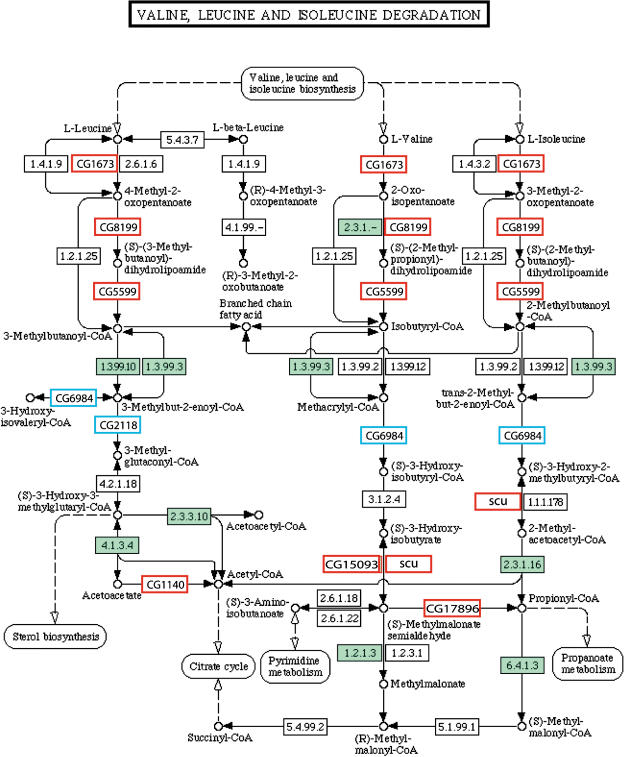
MicroRNAs (miRNAs) are short RNA molecules that regulate gene expression by binding to target messenger RNAs and by controlling protein production or causing RNA cleavage. To date, functions have been assigned to only a few of the hundreds of identified miRNAs, in part because of the difficulty in identifying their targets. The short length of miRNAs and the fact that their complementarity to target sequences is imperfect mean that target identification in animal genomes is not possible by standard sequence comparison methods. Here we screen conserved 3' UTR sequences from the Drosophila melanogaster genome for potential miRNA targets. The screening procedure combines a sequence search with an evaluation of the predicted miRNA-target heteroduplex structures and energies. We show that this approach successfully identifies the five previously validated let-7, lin-4, and bantam targets from a large database and predict new targets for Drosophila miRNAs. Our target predictions reveal striking clusters of functionally related targets among the top predictions for specific miRNAs. These include Notch target genes for miR-7, proapoptotic genes for the miR-2 family, and enzymes from a metabolic pathway for miR-277. We experimentally verified three predicted targets each for miR-7 and the miR-2 family, doubling the number of validated targets for animal miRNAs. Statistical analysis indicates that the best single predicted target sites are at the border of significance; thus, target predictions should be considered as tentative until experimentally validated. We identify features shared by all validated targets that can be used to evaluate target predictions for animal miRNAs. Our initial evaluation and experimental validation of target predictions suggest functions for two miRNAs. For others, the screen suggests plausible functions, such as a role for miR-277 as a metabolic switch controlling amino acid catabolism. Cross-genome comparison proved essential, as it allows reduction of the sequence search space. Improvements in genome annotation and increased availability of cDNA sequences from other genomes will allow more sensitive screens. An increase in the number of confirmed targets is expected to reveal general structural features that can be used to improve their detection. While the screen is likely to miss some targets, our study shows that valid targets can be identified from sequence alone.


Conflict of interest statement

The authors have declared that no conflicts of interest exist.

Figures

Figure 1
Figure 1. Features of Known miRNA Target Sequences
(A) Comparison of sequence conservation in the 3′ UTRs of miRNA target genes. For lin-14, lin-28, lin-41, and lin-57, comparison was between C. elegans and C. briggsae. For hid, comparison was between D. melanogaster and D. pseudoobscura. White regions indicate conservation, and black regions are not conserved under the conditions used for producing the 3′ UTR database (see Materials and Methods for details). The positions of predicted miRNA target sites from the literature are shown in red. Most of these UTRs contain multiple predicted target sequences, and while regulation of the UTR has been experimentally validated in each case, most individual sites have not been tested for function. (B) Detailed comparison of the pattern of sequence conservation in the conserved sites. Target site length is miRNA length plus 5 nt. For lin-57 we excluded three of the eight previously predicted sites that were not located in conserved sequence blocks and included a newly identified ninth site that is conserved. White type on black indicates residues that are not identical in the target sites in the two genomes. Black type on white indicates identity. All residues basepairing with positions 2–8 of the miRNA are identical in the conserved sites in both genomes.
Figure 2
Figure 2. miRNA Target Prediction Strategy
(A) let-7, lin-4, and bantam miRNA sequences showing the pattern of basepairing to their known targets. Yellow indicates a conventional basepair. Orange indicates a G:U basepair. Blue indicates a mismatch. The black bars indicate the positions of loops in the target sequence. Note that the extra bases that form the loops in the target sequences are not shown. Sequences are shown at the length of the miRNA. (B) Quantitation of the data from (A). This comparison shows that the 5′ ends of the miRNA are always involved in good pairing with target sequences and suggests that searches for complementarity to the first eight residues of the miRNA would select all known targets. (C) Graphic representation of the Mfold output for the bantam miRNA and a target site from the 3′ UTR of the hid gene. To use Mfold, it is necessary to join the predicted target site (red) and the miRNA (blue) into a single sequence using a hairpin-forming linker sequence. In this example, the target sequence and the miRNA are the same length, so the additional 5 nt in the tail of the predicted target sequence are not shown. (D) Plot of the Mfold free energy distribution for 10,000 random sequences (green) and for predicted targets of the bantam miRNA (red). X-axis: ΔG calculated for each site by Mfold.
Figure 3
Figure 3. Experimental Validation of miR-7 Targets
(A) Schematic representation of the E(spl) and Brd gene complexes, which contain multiple predicted miR-7 target genes. bHLH-type transcriptional repressors are shown in red. Brd-type proteins are shown in blue. Other transcripts in the E(spl) cluster are in gray. Black asterisks indicate sites with no mismatch in the first eight residues (likely to be valid sites). (B) miR-7 miRNA sequence showing the pattern of basepairing with target sites in E(spl) and Brd complex genes sorted in order of predicted folding energy. Yellow indicates a conventional basepair. Orange indicates a G:U basepair. Blue indicates a mismatch. The black bars indicate the position of loops in the target sites. (C) Expression of the miR-7 sensor transgene is shown in green. Expression of the red fluorescent protein miR-7 miRNA under ptc–Gal4 control is shown in red. The right panel shows the miR-7 sensor alone. (D and E) Expression of the m4 3′ UTR and hairy 3′ UTR sensor transgenes (green) were downregulated by miR-7 (red). Expression of the hairy 3′ UTR sensor was much lower than the m4 3′ UTR sensor overall. Cut protein, shown in blue, was downregulated in miR-7 expressing cells. The right panel shows a second example of Cut repression. The lower panel shows Cut channel alone. (F) ClustalW alignment of miR-7 target sites in the 3′ UTRs of hairy from several species. Asterisks indicate sequence identity. Black type indicates basepairs by Mfold (including G:U basepairs). Gray shading highlights the conserved miRNA–target binding region in all five species. (G) Cuticle preparations of a wild-type adult wing and a wing expressing miR-7 under ptc–Gal4 control in the region between veins 3 and 4. Note the notching of the wing and the reduction of the region between veins 3 and 4, leading to partial fusion proximally. The size of the posterior compartment was increased apparently to compensate for reduction of the vein 3–4 region.
Figure 4
Figure 4. Experimental Validation of miR-2 Targets
(A) Conservation of sequences in the 3′ UTRs of reaper, grim, and sickle genes of D. melanogaster and D. pseudoobscura. Blocks of high sequence similarity are color-coded. The location of predicted miR-2/miR-13 family target sites are underlined in black. (B) ClustalW alignment of predicted miR-2/miR-13 family target sites in the reaper, grim, and sickle 3′ UTRs. Z scores for miR-2a and miR-2b are shown for each site. The first bases of the grim and sickle sites do not pair with the miRNAs. Because we use a hairpin-forming linker sequence, this causes a penalty in Mfold, which gives these sites lower Z scores than they should otherwise have. (C) Immunoblot of S2 cells transfected to express a tubulin promoter–EGFP–reaper 3′ UTR construct (lane 2) or a comparable construct from which the miR-2/miR-13-binding site in the UTR was deleted (lane 3). Control cells were transfected with empty vector (lane 1). The blot was probed first with antibody to GFP and then reprobed with anti-tubulin as a loading control. (D and E) Expression of the grim and sickle 3′ UTR sensor transgenes (green) was downregulated by miR-2b expressed under ptc–Gal4 control (red).
Figure 5
Figure 5. Statistical Evaluation of Predicted Targets
Plot of E-values as a function of free energy of folding. Y-axis: logarithmic scale of E-values. X-axis: free energy of folding calculated by Mfold. Calculations for one, two, and four sites are shown separately. The position of the best bantam site in hid is shown for reference.
Figure 6
Figure 6. Valine, Leucine, and Isoleucine Catabolic Pathway
Enzymes identified as miR-277 targets are boxed and identified by CG number. Red boxes required Z > 3 in Anopheles. Blue boxes required Z > 2 in Anopheles. In addition to the predicted targets, the other enzymes for which the gene has been identified in Drosophila are shaded in green. The metabolic pathway chart is from http://www.genome.ad.jp/kegg/pathway/map/map00280.html.

References

    1. Abrahante JE, Daul AL, Li M, Volk ML, Tennessen JM, et al. The Caenorhabditis elegans hunchback-like gene lin-57/hbl-1 controls developmental time and is regulated by microRNAs. Dev Cell. 2003;4:625–637. - PubMed
    1. Ambros V. MicroRNAs: Tiny regulators with great potential. Cell. 2001;107:823–826. - PubMed
    1. Ambros V, Lee RC, Lavanway A, Williams PT, Jewell D. MicroRNAs and other tiny endogenous RNAs in C. elegans. Curr Biol. 2003;13:807–818. - PubMed
    1. Aravin AA, Lagos-Quintana M, Yalcin A, Zavolan M, Marks D, et al. The small RNA profile during Drosophila melanogaster development. Dev Cell. 2003;5:337–350. - PubMed
    1. Baonza A, Garcia-Bellido A. Notch signaling directly controls cell proliferation in the Drosophila wing disc. Proc Natl Acad Sci U S A. 1999;97:2609–2614. - PMC - PubMed

Associated data