Comparative Study
. 2004 Jan;86(1 Pt 1):134-44.
doi: 10.1016/S0006-3495(04)74091-6.

Imaging single cardiac ryanodine receptor Ca2+ fluxes in lipid bilayers

Affiliations
Comparative Study

Imaging single cardiac ryanodine receptor Ca2+ fluxes in lipid bilayers

S Peng et al. Biophys J. 2004 Jan.

Abstract

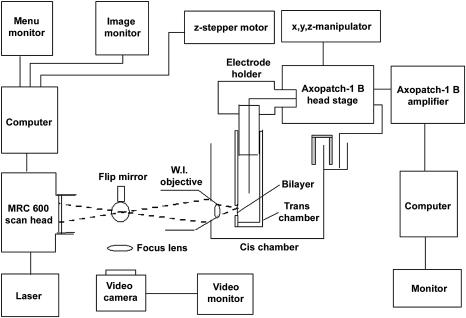
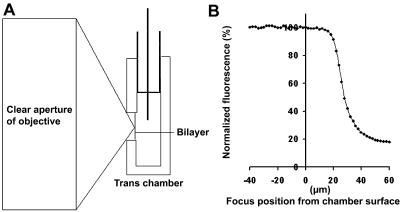
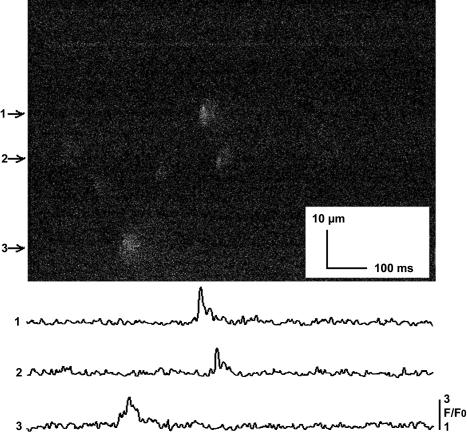
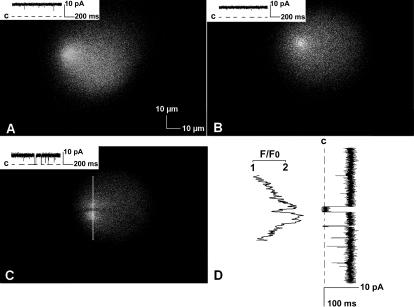
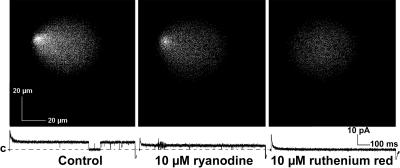
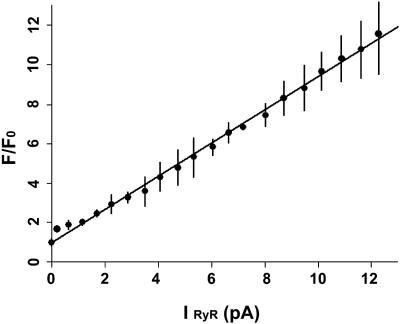
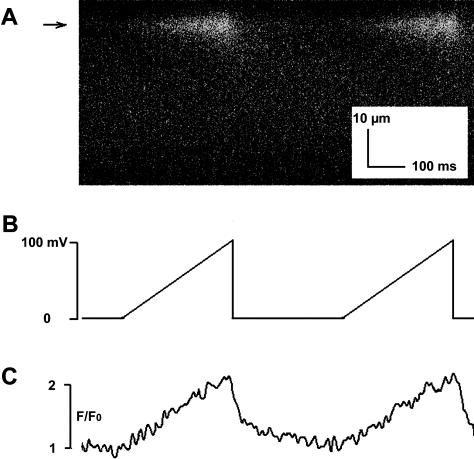
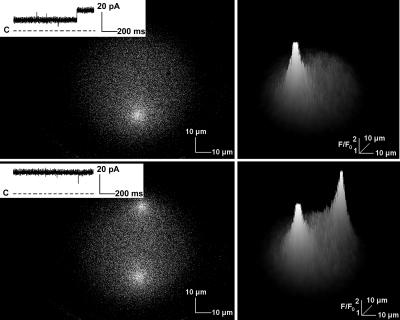
In this and an accompanying report we describe two steps, single-channel imaging and channel immobilization, necessary for using optical imaging to analyze the function of ryanodine receptor (RyR) channels reconstituted in lipid bilayers. An optical bilayer system capable of laser scanning confocal imaging of fluo-3 fluorescence due to Ca2+ flux through single RyR2 channels and simultaneous recording of single channel currents was developed. A voltage command protocol was devised in which the amplitude, time course, shape, and hence the quantity of Ca2+ flux through a single RyR2 channel is controlled solely by the voltage imposed across the bilayer. Using this system, the voltage command protocol, and concentrations of Ca2+ (25-50 mM) that result in saturating RyR2 Ca2+ currents, proportional fluo-3 fluorescence was recorded simultaneously with Ca2+ currents having amplitudes of 0.25-14 pA. Ca2+ sparks, similar to those obtained with conventional microscope-based laser scanning confocal systems, were imaged in mouse ventricular cardiomyocytes using the optical bilayer system. The utility of the optical bilayer for systematic investigation of how cellular factors extrinsic to the RyR2 channel, such as Ca2+ buffers and diffusion, alter fluo-3 fluorescent responses to RyR2 Ca2+ currents, and for addressing other current research questions is discussed.


Figures

FIGURE 1
FIGURE 1
Components of the optical bilayer system. A schematic illustrating the components of an optical bilayer system capable of simultaneous measurement of fluorescence and electrical currents is shown. Fluo-3 fluorescence is imaged using a Bio-Rad MRC 600 confocal system, a water immersion (WI) objective (70×, NA 1.2), and an argon ion laser. The trans chamber is attached via a 2-mm glass capillary tube and an electrode holder to the head stage of a patch-clamp amplifier. The head stage is mounted on a 3-axis translation stage controlled by a hydraulic manipulator. Front-to-back movements of the trans chamber relative to the objective, which is fixed horizontally in the cis chamber, are used for focusing. The latter movements are imposed using a computer-controlled stepper motor. See text for additional details.
FIGURE 2
FIGURE 2
Geometric considerations for optical imaging of planar lipid bilayers. The distance between the plane of the bilayer and the front surface of the trans chamber impacts optical measurements. The profile of the laser beam focused by a 70× high NA objective is cartooned in panel A. Due to its profile, the beam cannot be scanned very deeply into the hole without being scattered by the edges of the hole. This scattering causes a loss of signal intensity from a uniformly distributed fluorescent solution as the plane of focus is moved into the hole (panel B). To ensure that the entire surface of the bilayer is scanned (see Fig. 3), it is necessary to make the thickness of the trans-chamber wall 15 μm or less.
FIGURE 3
FIGURE 3
Locating the bilayer. Bilayers are imaged using reflected 633-nm light to establish their location relative to the front surface of the trans chamber. A bilayer formed in a 100-μm diameter hole is shown in this image. The bilayer is the black inner circle and is ∼70 μm in diameter. The torus around the bilayer is shown by the white interference pattern and outer black region. The edge of the hole is the black to white transition. The depth of the bilayer in the hole is measured as the distance between the bilayer focal plane and the front surface of the trans chamber.
FIGURE 4
FIGURE 4
Sparks imaged in intact mouse cardiomyocytes with the optical bilayer system. A x-t line scan image of sparks in an intact ventricular cardiomyocyte bathed in 1 mM Ca2+ is shown. Myocytes were permitted to settle onto laminin-coated coverslips, which were fixed to the surface of the trans chamber in place of the bilayer partition. The trans chamber was positioned as for a bilayer experiment and the optical system was identical to that used to image Ca2+ fluxes across the bilayer. Intensity-time traces for the sparks numbered as indicated on the left side of the image are shown in the lower part of the figure. Cumulative data for the properties of sparks imaged in intact myocytes are presented in Table 1.
FIGURE 5
FIGURE 5
Bilayer “Ca2+ sparks.” Three examples of fluo-3 fluorescence recorded in response to Ca2+ flux through single RyR2 channels reconstituted in bilayers are shown in panels AC. These images contain 768 × 512 pixels (0.12 μm/pixel) and required 1 s to acquire (the scanning pattern was left to right, then top to bottom). Simultaneous recordings of single RyR2 channel currents are shown in the inset in each panel, where “C” indicates the level of zero net current. The dark horizontal zone through the bright center of the fluorescence signal in panel C resulted from a brief closing of the channel while the position of the channel was being scanned. An intensity versus time trace obtained from top to bottom through the center of the fluorescence (white vertical line in panel C) is aligned with the current trace in panel D. The conditions used in these experiments resulted in current amplitudes of 8–10 pA. The illuminated areas approximate the dimensions of the hole containing the bilayers. Background fluorescence is due to buildup of Ca2+ in the cis chamber with repeated voltage steps.
FIGURE 6
FIGURE 6
Fluo-3 fluorescence and Ca2+ currents are the result of Ca2+ flux through RyR2 channels. Fluo-3 fluorescence and RyR2 Ca2+ currents are reduced by 10 μM ryanodine to subconductance state levels (middle panel) and abolished by 10 μM ruthenium red (right panel). Both ryanodine and ruthenium red were added to the cis chamber. The capacitance transients associated with the current traces were reduced graphically by ∼50% during figure preparation. “C” indicates the level of zero current. These data confirm that both the fluorescence and the currents are due to Ca2+ flux through a RyR2 channel.
FIGURE 7
FIGURE 7
Fluo-3 fluorescence is proportional to the Ca2+ flux through a RyR2 channel. Ca2+ currents with different amplitudes were generated using the VC protocol. Fluo-3 fluorescence signals increased proportionally in response to Ca2+ current amplitudes of 0.25–12 pA.
FIGURE 8
FIGURE 8
The VC protocol can be used to produce Ca2+ fluxes having arbitrarily complex waveforms. A x-t line scan image of fluo-3 fluorescence in response to Ca2+ fluxes through a single RyR2 channel (panel A) were elicited in the bilayer system using voltage ramps (panel B). Fluorescence intensity-time traces obtained at the location indicated by the arrow in panel A are shown in panel C. As in Table 1, values were obtained by averaging data from five lines centered on the spark. These data illustrate the capability of the VC protocol to mimic different rates of activation and inactivation of clusters of multiple RyR2 channels. In addition, the temporal similarity between the voltage command signal and the imaged fluorescence demonstrate the temporal properties of the optical bilayer system.
FIGURE 9
FIGURE 9
Ca2+ flux through multiple RyR2 channels imaged in the bilayer system. A single RyR2 channel was active during most of the 1-s x,y scan shown in the top left panel. A second RyR2 channel activated toward the end of the scan, but only a single fluorescent signal was observed since this channel was in a region of the bilayer that had already been imaged. Both RyR2 channels were active during the entirety of a subsequent scan (bottom left panel) and two discrete fluorescent signals were recorded. RyR2 Ca2+ currents recorded during the scans are shown in the insets of these panels. Three-dimensional representations of the associated intensity changes are shown in the panels on the right side of the figure. The flattened tops of the signals result from the square shape of the Ca2+ flux and not from signal saturation.

References

    1. Airey, J. A., C. F. Beck, K. Murakami, S. J. Tanksley, T. J. Deerinck, M. H. Ellisman, and J. L. Sutko. 1990. Identification and localization of two triad junctional foot protein isoforms in mature avian fast twitch skeletal muscle. J. Biol. Chem. 265:14187–14194. - PubMed
    1. Baylor, S. M., S. Hollingworth, and W. K. Chandler. 2002. Comparison of simulated and measured calcium sparks in intact skeletal muscle fibers of the frog. J. Gen. Physiol. 120:349–368. - PMC - PubMed
    1. Blunck, R., J. L. Vazquez-Ibar, Y.-S. Liu, E. Perozo, and F. Bezanilla. 2003. Fluorescence measurements of KcsA channels in artificial bilayers. Biophys. J. 84:124a. (Abstr.) - PubMed
    1. Borisenko, V., T. Lougheed, J. Hesse, E. Fureder-Kitzmuller, N. Fertig, J. C. Behrends, G. A. Woolley, and G. J. Schutz. 2003. Simultaneous optical and electrical recording of single gramicidin channels. Biophys. J. 84:612–622. - PMC - PubMed
    1. Cannell, M. B., and C. Soeller. 2002. A mode of thought in excitation-contraction coupling. Biophys. J. 83:1–2. - PMC - PubMed

Publication types

MeSH terms