Comparative Study
. 2004 Jan;86(1 Pt 1):359-70.
doi: 10.1016/S0006-3495(04)74112-0.

Interplay of troponin- and Myosin-based pathways of calcium activation in skeletal and cardiac muscle: the use of W7 as an inhibitor of thin filament activation

Affiliations
Comparative Study

Interplay of troponin- and Myosin-based pathways of calcium activation in skeletal and cardiac muscle: the use of W7 as an inhibitor of thin filament activation

Bishow B Adhikari et al. Biophys J. 2004 Jan.

Abstract

To investigate the interplay between the thin and thick filaments during calcium activation in striated muscle, we employed n-(6-aminohexyl) 5-chloro-1-napthalenesulfonamide (W7) as an inhibitor of troponin C and compared its effects with that of the myosin-specific inhibitor, 2,3-butanedione 2-monoxime (BDM). In both skeletal and cardiac fibers, W7 reversibly inhibited ATPase and tension over the full range of calcium activation between pCa 8.0 and 4.5, resulting in reduced calcium sensitivity and cooperativity of ATPase and tension activations. At maximal activation in skeletal fibers, the W7 concentrations for half-maximal inhibition (KI) were 70-80 micro M for ATPase and 20-30 micro M for tension, nearly >200-fold lower than BDM (20 mM and 5-8 mM, respectively). When W7 (50 microM) and BDM (20 mM) were combined in skeletal fibers, the ATPase and tension-pCa curves exhibited lower apparent cooperativity and maxima and higher calcium sensitivity than expected from two independent activation pathways, suggesting that the interplay between the thin and thick filaments varies with the level of activation. Significantly, the inhibition of W7 increased the ATPase/tension ratio during activation in both muscle types. W7 holds much promise as a potent and reversible inhibitor of thin filament-mediated calcium activation of skeletal and cardiac muscle contraction.


Figures
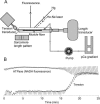
FIGURE 1
FIGURE 1
Schematic of instrument and an example of raw data obtained during calcium activation of ATPase and tension. (A) Single skeletal fiber or a small bundle of cardiac papillary fibers is mounted between two tweezers, one attached to a length controller and the other to a force transducer, inside a cuvette. Solution of varying pCa can be pumped around the sample using a peristaltic pump and a pCa gradient maker that mixes solutions of low and high calcium. For fluorescence measurements, excitation light is focused on the sample, and two detectors, one of each for the signal and the background, are used to collect the resulting fluorescence with appropriate excitation and emission filters. Sarcomere length is measured from diffraction patterns from a He-Ne laser. (B) Raw data of NADH fluorescence (ATPase) and tension that are used to construct two calcium activation curves of the same single rabbit psoas fiber.
FIGURE 2
FIGURE 2
The reversible inhibition of isometric tension of rabbit psoas fibers by W7 at pCa 4.0. (A) A single fiber, initially under relaxation, was activated at pCa 4.0 and subjected to increasing and decreasing concentrations of W7 before another final relaxation. The numbers above the trace indicate the concentration of W7 in μM. (B) Another fiber was treated with 300 μM W7 after activation, which resulted in tension levels approaching the relaxing value, and then treated with 50, 20, and 10 μM W7 with a corresponding recovery of tension. Subsequently, when the fiber was treated with relaxing solution the tension returned to relaxing values. (C) The same fiber from B after 10 min relaxation was activated first in 300 μM W7; then without W7; then finally relaxed.
FIGURE 3
FIGURE 3
Isometric tension and stiffness at pCa 4.0 of rabbit psoas fibers as a function of W7 concentration. Tension was normalized to values obtained without W7. The data were obtained from four experiments at 20°C (solid symbols) and three experiments at 5°C (unfilled symbols). The solid lines are drawn to fit the tension data using an equation of a hyperbola with half-maximal values (KI-Tension) of 22 μM at 20°C and 32 μM at 5°C. Inset shows the proportionality between tension and stiffness (2000, 440, and 96 Hz) at the indicated W7 concentrations at 20°C.
FIGURE 4
FIGURE 4
The reversible inhibition of calcium activation of ATPase and tension of single rabbit psoas fibers by W. The pCa curves of ATPase (unfilled symbols) and tension (solid symbols) from two adjacent sections (I and II) of a single fiber are plotted against the solution pCa. Multiple activation cycles, each preceded by a period of relaxation, were carried on two adjacent sections of a single fiber in the presence of the indicated concentrations of W7. The activation sequences were 100 μM (I-Cycle 1) and 0 μM (I-Cycle 2) in the first fiber section, and 300 μM (II-Cycle 1), 20 μM (II-Cycle 2), and 0 μM (II-Cycle 3) in the second fiber section. The data were normalized to the curves at 0 μM W7 in each set. The fitted values of midpoint (pK) and slope (n, in parentheses) are given next to each curve. An example of ATPase/force-pCa curves from an untreated fiber is shown for comparison. The brackets (l for leading component and t for trailing component) indicate the components of ATPase that are not accompanied by significant levels of tension.
FIGURE 5
FIGURE 5
The reversible inhibition of calcium activation of ATPase and tension by W7 in mouse heart fibers. All activation curves were obtained sequentially from the same sample, after relaxation of muscle between each activation, in the following order: without W7 (Cycle 1), with 100 μM W7 (Cycle 2), with 25 μM W7 (Cycle 3), and finally again after washing W7 (Cycle 4). The data were normalized to the curves obtained in the first activation cycle without W7 (Cycle 1). The fitted values of pK and n (in parentheses) are given next to each curve.
FIGURE 6
FIGURE 6
The inhibition of calcium activation of tension and ATPase of a rabbit psoas fiber by BDM and by BDM and W7. All activation curves were obtained sequentially in the same fiber, after relaxation of sample between each activation, in the following order: 30 mM BDM (Cycle 1), 10 mM BDM plus 50 μM W7 (Cycle 2), 10 mM BDM (Cycle 3), and finally without BDM and W7 (Cycle 4; note that the fiber broke near the maximum activation). The data were normalized to the curves without BDM and W7 (Cycle 4; l over bracket indicates the leading component of ATPase as in Fig. 4). Fitted values of pK and n (in brackets) are given next to each curve.
FIGURE 7
FIGURE 7
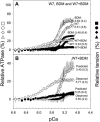
Enhancement of inhibition by the combination of 50 μM W7 and 10 mM BDM in single fibers from rabbit psoas muscle. Average ATPase and tension-pCa curves are plotted for 50 μM W7, 10 mM BDM, 50 μM W7, and 10 mM BDM in A. The pCa curves of the combined W7 and BDM data are compared with that of the predicted curves based on sums of each inhibition curves in B. The fitted values of pK and n (in parentheses) for the ATPase and tension curves are given next to each curve. Note the significant drops in cooperativity and maximal values that lead to higher sensitivities when W7 and BDM are combined. The data were obtained from individual activations in 3–4 fibers for each condition.
FIGURE 8
FIGURE 8
Relative tension cost (ATPase/tension) during activation in the presence of W7 and BDM. The ATPase/tension ratios are plotted against the solution pCa for activations of skeletal and cardiac fibers at the indicated concentrations of W7 and BDM. (A) W7 inhibition in skeletal fibers; (B) W7 inhibition in cardiac fibers; and (C) BDM inhibition in skeletal fibers.
SCHEME 1
SCHEME 1

References

    1. Adhikari, B., K. Hideg, and P. G. Fajer. 1997. Independent mobility of catalytic and regulatory domains of myosin heads. Proc. Natl. Acad. Sci. USA. 94:9643–9647. - PMC - PubMed
    1. Adhikari, B. B., and K. Wang. 2001. S100A1 modulates skeletal muscle contraction by desensitizing calcium activation of isometric tension, stiffness and ATPase. FEBS Lett. 497:95–98. - PubMed
    1. al-Khayat, H. A., N. Yagi, and J. M. Squire. 1995. Structural changes in actin-tropomyosin during muscle regulation: computer modeling of low-angle x-ray diffraction data. J. Mol. Biol. 252:611–632. - PubMed
    1. Allen, K., Y. Y. Xu, and W. G. Kerrick. 2000. Ca2+ measurements in skinned cardiac fibers: effects of Mg2+ on Ca2+ activation of force and fiber ATPase. J. Appl. Physiol. 88:180–185. - PubMed
    1. Bagshaw, C. R. 1993. Muscle Contraction. Chapman & Hal, London and New York.

Publication types

MeSH terms

LinkOut - more resources