. 2004 Jan;86(1 Pt 1):609-16.
doi: 10.1016/S0006-3495(04)74139-9.

Single-molecule imaging of the H-ras membrane-anchor reveals domains in the cytoplasmic leaflet of the cell membrane

Affiliations

Single-molecule imaging of the H-ras membrane-anchor reveals domains in the cytoplasmic leaflet of the cell membrane

Piet H M Lommerse et al. Biophys J. 2004 Jan.

Abstract

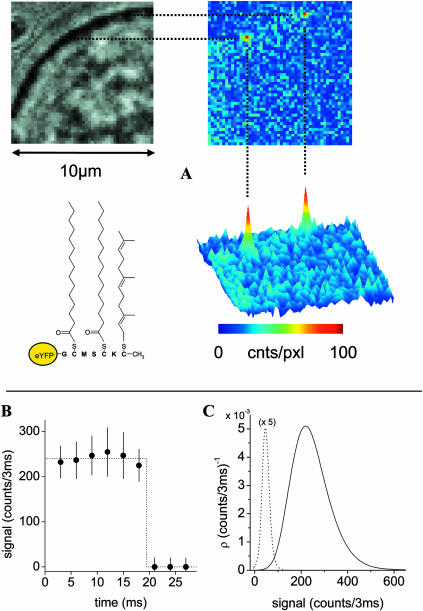
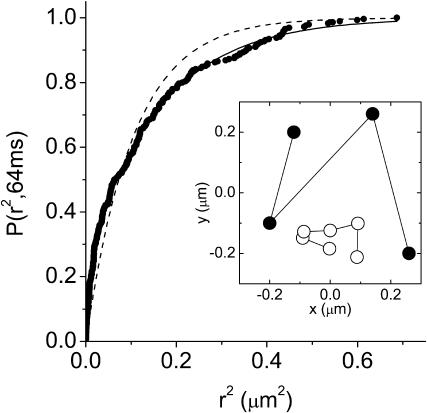
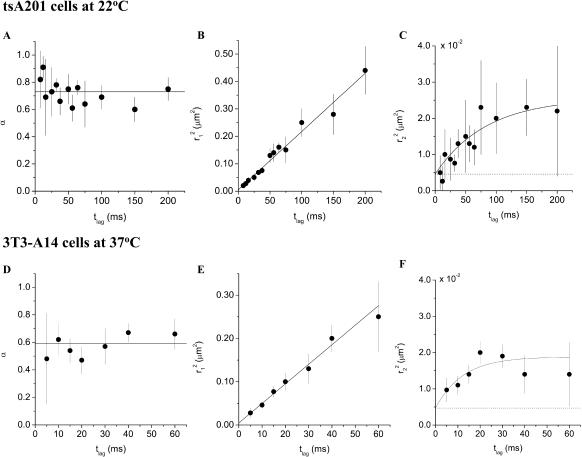
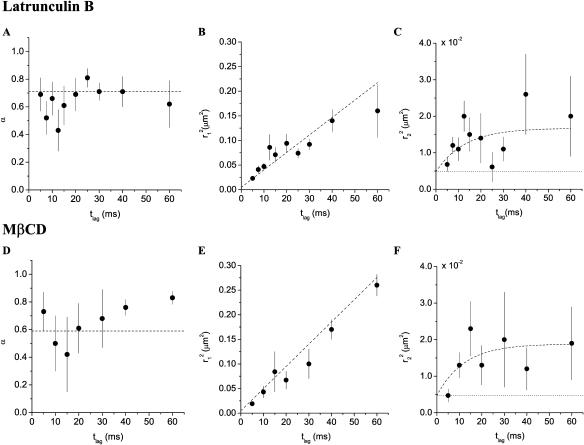
In the last decade evidence has accumulated that small domains of 50-700 nm in diameter are located in the exoplasmic leaflet of the plasma membrane. Most of these domains supposedly consist of specific sets of lipids and proteins, and are believed to coordinate signal transduction cascades. Whether similar domains are also present in the cytoplasmic leaflet of the plasma membrane is unclear so far. To investigate the presence of cytoplasmic leaflet domains, the H-Ras membrane-targeting sequence was fused to the C-terminus of the enhanced yellow fluorescent protein. Using single-molecule fluorescence microscopy, trajectories of individual molecules diffusing in the cytoplasmic leaflet of the plasma membrane were recorded. From these trajectories, the diffusion of individual membrane-anchored enhanced yellow fluorescent protein molecules was studied in live cells on timescales from 5 to 200 ms. The results show that the diffusion of 30-40% of the molecules is constrained in domains with a typical size of 200 nm. Neither breakdown of actin nor cholesterol extraction changed the domain characteristics significantly, indicating that the observed domains may not be related to the membrane domains identified so far.


Figures

FIGURE 1
FIGURE 1
(A) Schematic drawing of the eYFP-C10HRas protein including the S-prenyl and two S-palmitoyl groups. White light (upper left) and corresponding fluorescence images (upper and lower right) of a tsA201 cell transfected with DNA encoding for eYFP-C10HRas. For the fluorescence image the cell was illuminated using 514-nm laser light for 3 ms at an intensity of 2 kW/cm2. Two membrane-localized signals attributed to single fluorescent proteins are present. (B) Example of a single-step photobleaching event of an individual eYFP-C10HRas, indicative for an individual fluorophore. (C) Analysis of 240 signals of individual eYFP-C10HRas molecules observed at the apical membrane of tsA201 cells (solid line). The probability density of the signal amplitude is nearly Gaussian-shaped with a maximum of 220 counts/3 ms. The statistics of the background signal (dashed line) is shown for comparison, being characterized by a width of σB = 19 counts/3 ms.
FIGURE 2
FIGURE 2
Cumulative distribution function for square displacements (N = 290), P(r2,tlag), of individual eYFP-C10HRas molecules observed at the apical membrane of 10 different tsA201 cells. Data were obtained with a time lag of 64 ms. The solid line represents the result of a biexponential fit according to Eq. 2, yielding formula image, and α = 0.76 ± 0.05. A monoexponential fit according to Eq. 1 (dashed line) fails. The inset shows two trajectories of individual eYFP-C10HRas molecules at the apical membrane of a tsA201 cell. The time between subsequent observations was 80 ms.
FIGURE 3
FIGURE 3
Results obtained from the square displacement distribution analysis (according to Fig. 2) of data taken on tsA201 cells at 22°C (A–C), and data taken on 3T3-A14 cells at 37°C (D–F). The results of the fits are given in Table 1. The error bars represent the standard errors obtained from the fits of the data according to Eq. 2. (A and D) Fractions of the fast component, α, versus tlag for the two cell types studied. (B and E) The mean-square displacements, formula image of the fast fraction versus tlag. The data are fitted according to a free diffusion model (formula image solid line). (C and F) Mean-square displacements, formula image, of the slow fraction versus tlag. The data are fitted according to a confined diffusion model (Eq. 3, solid line). The dotted lines in C and F represent the offset due to the limited positional accuracy (see Materials and Methods); they have been omitted in B and E for clarity.
FIGURE 4
FIGURE 4
Results obtained from the square displacement distribution analysis of data taken on 3T3-A14 cells at 37°C after drug treatment. The fit results obtained for DMSO-treated cells (AC) and untreated cells (DF) are shown for comparison as dashed lines, results from the fits are given in Table 1. (A–C) Fraction (A) and mean-squared displacement of the fast (B) and the slow (C) fraction after treatment with 0.5 μM latrunculin B for 30 min. (D–F) Fraction (D), and mean-squared displacement of the fast (E) and the slow (F) fraction after treatment with 5 mM methyl-β-cyclodextrin for 1 h. The dotted lines in C and F represent the offset due to the limited positional accuracy (see Materials and Methods); they have been omitted in B and E for clarity.

References

    1. Almeida, P. F. F., and W. L. C. Vaz. 1995. Lateral diffusion in membranes. In Handbook of Biological Physics. R. Lipowsky and E. Sackmann, editors. Elsevier/North Holland, Amsterdam, The Netherlands. 305–357.
    1. Anderson, C. M., G. N. Georgiou, I. E. Morrison, G. V. Stevenson, and R. J. Cherry. 1992. Tracking of cell surface receptors by fluorescence digital imaging microscopy using a charge-coupled device camera. Low-density lipoprotein and influenza virus receptor mobility at 4°C. J. Cell Sci. 101:415–425. - PubMed
    1. Apolloni, A., I. A. Prior, M. Lindsay, R. G. Parton, and J. F. Hancock. 2000. H-ras but not K-ras traffics to the plasma membrane through the exocytic pathway. Mol. Cell. Biol. 20:2475–2487. - PMC - PubMed
    1. Baker, T. L., M. A. Booden, and J. E. Buss. 2000. S-Nitrosocysteine increases palmitate turnover on Ha-Ras in NIH 3T3 cells. J. Biol. Chem. 275:22037–22047. - PubMed
    1. Bobroff, N. 1976. Position measurement with a resolution and noise-limited instrument. Rev. Sci. Instrum. 57:1152–1157.

Publication types

Substances