Comparative Study
. 2004 Jan;86(1 Pt 1):629-45.
doi: 10.1016/S0006-3495(04)74141-7.

NADH enzyme-dependent fluorescence recovery after photobleaching (ED-FRAP): applications to enzyme and mitochondrial reaction kinetics, in vitro

Affiliations
Comparative Study

NADH enzyme-dependent fluorescence recovery after photobleaching (ED-FRAP): applications to enzyme and mitochondrial reaction kinetics, in vitro

Frederic Joubert et al. Biophys J. 2004 Jan.

Abstract

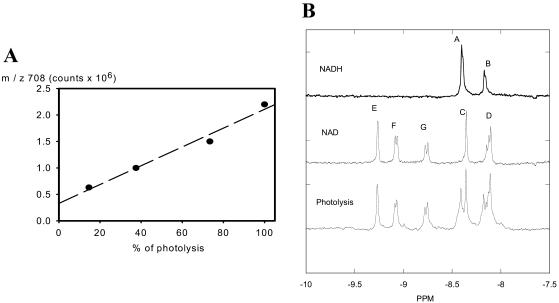
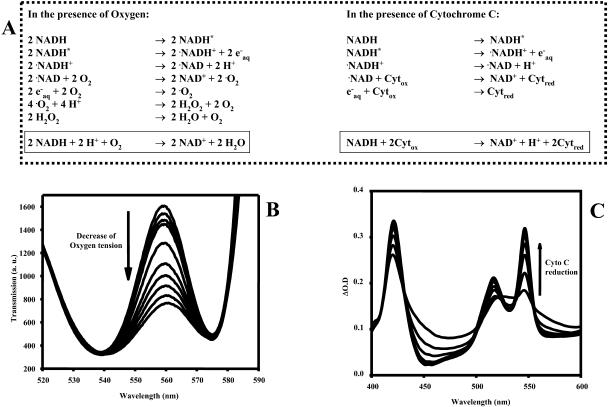
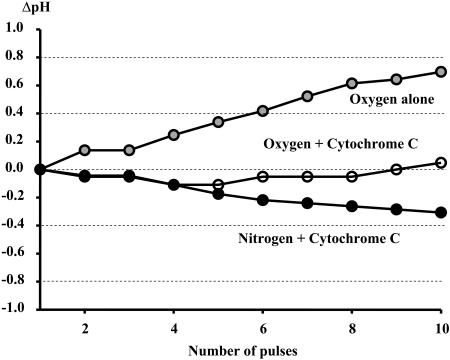
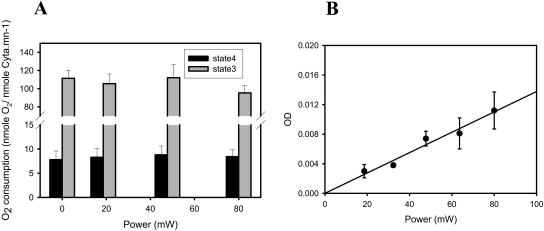
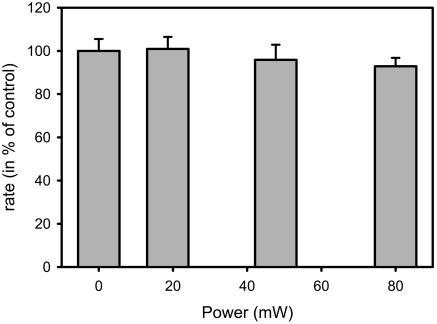
NADH enzyme-dependent fluorescence recovery after photobleaching (ED-FRAP) was evaluated for studying enzyme kinetics in vitro and in isolated mitochondria. Mass, optical, and nuclear magnetic resonance spectroscopy data were consistent with the UV NADH photolysis reaction being NADH --> NAD* + H+ + e-. The overall net reaction was O2 + 2NADH + 2H+ --> 2NAD+ + 2H2O, or in the presence of other competing electron acceptors such as cytochrome c, NADH + 2Cyt(ox) --> NAD+ + H+ + 2Cyt(red). Solution pH could differentiate between these free-radical scavenging pathways. These net reactions represent the photooxidation of NADH to NAD+. Kinetic models and acquisition schemes were developed, varying [NADH] and [NAD] by altering NADH photolysis levels, for extracting kinetic parameters. UV irradiation levels used did not damage mitochondrial function or enzymatic activity. In mitochondria, [NADH] is a high affinity product inhibitor that significantly reduced the NADH regeneration rate. Matrix NADH regeneration only slightly exceeded the net rate of NADH consumption, suggesting that the NADH regeneration process is far from equilibrium. Evaluation of NADH regeneration in active mitochondria, in comparison to rotenone-treated preparations, revealed other regulatory elements in addition to matrix [NADH] and [NAD] that have yet to be fully characterized. These studies demonstrate that the rapid UV photolysis of NADH to NAD is an effective tool in evaluating the steady-state kinetic properties of enzyme systems. Initial data support the notion that the NADH regeneration process is far from equilibrium in mitochondria and is potentially controlled by NADH levels as well as several other matrix factors.


Figures

FIGURE 1
FIGURE 1
Mass spectroscopy and NMR data on NADH photolysis. (A) Mass spectroscopy data. The relationship between the degree of NADH photolysis and the abundance of m/z 708 (disodium salt of NAD). Degree of photolysis was determined by 100 × (1−(NADHphotolysis/NADHc)) where NADHc is control fluorescence and NADHphotolysis is fluorescence after photolysis. (B) 300 MHz proton spectrums of NAD, NADH, and photolysis products of NADH. All samples were initially 0.4 mM in 100 mM phosphate buffer pH 7.0. Each spectrum is the average of 600 transients collected in 2-s intervals. Resonance assignments: NADH is A, C8 of adenosine, and B, C2 of adenosine. NAD is C, C8 of adenine, D, C2 of adenine, E, C2 of nicotinamide, F, C6 of nicotinamide, and G, C4 of nicotinamide. Assignments based on Sarma et al. (1968), Meyer et al. (1962), and Jardetzky and Wade-Jardetzky (1966).
FIGURE 2
FIGURE 2
Enzymatic reversal of NADH photolysis. Insert represents a time course of a typical experiment. After NADH photolysis, ADH was injected into the cuvette and the NADH recovery determined. The photolysis percentage was calculated as outlined in Fig. 1, and recovery percentage was determined as 100*(NADHcNADHADH)/(NADHcNADHphotolysis), where NADHADH is the fluorescence level after the addition of ADH.
FIGURE 3
FIGURE 3
Proposed mechanisms and products of NADH photolysis in the presence of O2 or oxidized cytoc. (A) Proposed reaction pathways for oxygen or oxidized cytoc for scavenging photolysis-generated free radicals. (B) Effect of NADH photolysis on hemoglobin (Hb) oxygenation. A series of UV pulses was applied to a 200-μM NADH sample including 250 μM of hemoglobin. The absorption spectrum of the hemoglobin is presented in a stack plot. The oxygenation of the sample decreased with each irradiation pulse as evidenced by the decrease in absorbance at ∼560 nm. Note that the nonlinear dependence of hemoglobin oxygenation on oxygen tension contributed to the nonlinear response of absorbance to the photolysis steps. (C) Reduction of cytoc during the photolysis of NADH. A series of UV pulse as applied to the sample of NADH including 20 mM of oxidized cytoc. An increase in cytoc reduction was observed by the absorbance changes at ∼550 nm. Absorbance changes at ∼520 and ∼416 nm were also characteristic of cytoc.
FIGURE 4
FIGURE 4
Effect of NADH photolysis on pH. The solution pH was followed from SNARF fluorescence. Experiments were conducted on 1 mM in pure water in the absence of additional pH buffers. Experiments were conducted in the presence of oxygen, oxygen and oxidized cytoc (20 mM), or oxidized cytoc alone (nitrogen environment). As predicted from the equations in Fig. 3, the photolysis of NADH was associated with an increase in pH in oxygen, whereas in the presence of cytoc a net decrease in pH was observed.
FIGURE 5
FIGURE 5
Effect of NADH photolysis on isolated mitochondria respiration and light scattering. (A) Mitochondria respiratory rate at States 3 and 4 as a function of UV irradiation power. (B) Effect of UV irradiation on mitochondria light scattering at 540 nm.
FIGURE 6
FIGURE 6
Effect of pre-NADH photolysis on mitochondria extract DH enzymatic activity. The production NADH rate was monitored on extracts after preirradiated intact mitochondria with different UV power levels from 18.6 to 80 mW. Extract reaction was initiated by the addition of 5 mM G/M along with varying amounts of NAD. NADH levels were monitored spectrophotometrically in a standard cuvette instrument (PerkinElmer).
FIGURE 7
FIGURE 7
Time course of NADH fluorescence in an ED-FRAP experiment. Experiment was performed on the HDH system outlined in Methods. Analysis focused on the initial rate of recovery that was linear for the first 1-s measurement. Different levels of NADH photolysis (shown in small panel) essentially simultaneously varied the [NADH] and [NAD] aiding in the extraction of kinetic parameters for the reaction. Note that in this specific case, the full recovery can be considered as a simple monoexponential process.
FIGURE 8
FIGURE 8
Initial slope analysis of GDH NADH ED-FRAP experiments. (A) Linear regression of initial NADH recovery after photobleaching for different levels of NADH photolysis. Note the increase of the slope when the amount of [NADH] is decreased and [NAD] is increased. (B) Linear relationship between initial slope and initial [NADH0] level. To extrapolate to [NADH0] = 0 allows obtaining an estimation of Vmaxf; see text. (C) Estimated Vmaxf vs. [GDH] concentration. The linear relationship shows that the estimated Vmaxf is well related to enzyme concentration.
FIGURE 9
FIGURE 9
Initial slope analysis of ADH NADH ED-FRAP experiments. (Top left) Relation between initial slope and amount of photolyzed NADH. A classical Michaelis-Menten relationship is observed as expected. (Top right) Linear relationship observed between the parameters 1/C1 and [NADH] consistent with Eq. 7. (Bottom left) Effect of [ADH] variation on the relation between the initial recovery and the amount of photolyzed NADH. (Bottom right) Demonstration of the dependence of the parameter C1 of Eq. 7 with [ADH].
FIGURE 10
FIGURE 10
NADH ED-FRAP experiments on isolated porcine heart mitochondria. Mitochondria were pretreated with 40 μM of rotenone to block any net flux through the system. (A) Time courses of NADH recovery after NADH photolysis. Variable degrees of NADH photolysis was accomplished by varying UV laser power from 18.6 to 80 mW. (B) Observed relationship between initial slope and the amount of NADH photolyzed, consistent with Eq. 7.
FIGURE 11
FIGURE 11
Comparison of rotenone, State 4, and State 3 mitochondrial NADH ED-FRAP initial rate data. The initial recovery rate is plotted versus the [NADHo] in nM NADH/nM cytoa. (Rotenone, solid circles; State 4, unfilled circles, and State 3, solid triangles.) The shift in the curves is due to the differences in the starting [NADH] under the three different conditions.

References

    1. Balaban, R. S. 2002. Cardiac energy metabolism homeostasis: role of cytosolic calcium. J. Mol. Cell. Cardiol. 34:1259–1271. - PubMed
    1. Balaban, R. S., V. K. Mootha, and A. Arai. 1996. Spectroscopic determination of cytochrome c oxidase content in tissues containing myoglobin or hemoglobin. Anal. Biochem. 237:274–278. - PubMed
    1. Barlow, C. H., and B. Chance. 1976. Ischemic areas in perfused rat hearts: measurement by NADH fluorescence photography. Science. 193:909–910. - PubMed
    1. Boldridge, D. W., T. H. Morton, and G. W. Scott. 1984. Formation kinetics and quantum yield of photon-induced electron ejection from NADH in aqueous solution. Chem. Phys. Lett. 108:461–465.
    1. Chance, B., P. Cohen, F. Jobsis, and B. Schoener. 1962. Intracellular oxidation-reduction states in vivo. Science. 137:499–508. - PubMed

LinkOut - more resources