Comparative Study
. 2004 Jan;86(1 Pt 1):646-55.
doi: 10.1016/S0006-3495(04)74142-9.

Synaptic integration in electrically coupled neurons

Affiliations
Comparative Study

Synaptic integration in electrically coupled neurons

Elizabeth García-Pérez et al. Biophys J. 2004 Jan.

Abstract

Interactions among chemical and electrical synapses regulate the patterns of electrical activity of vertebrate and invertebrate neurons. In this investigation we studied how electrical coupling influences the integration of excitatory postsynaptic potentials (EPSPs). Pairs of Retzius neurons of the leech are coupled by a nonrectifying electrical synapse by which chemically induced synaptic currents flow from one neuron to the other. Results from electrophysiology and modeling suggest that chemical synaptic inputs are located on the coupled neurites, at 7.5 microm from the electrical synapses. We also showed that the space constant of the coupled neurites was 100 microm, approximately twice their length, allowing the efficient spread of synaptic currents all along both coupled neurites. Based on this cytoarchitecture, our main finding was that the degree of electrical coupling modulates the amplitude of EPSPs in the driving neurite by regulating the leak of synaptic current to the coupled neurite, so that the amplitude of EPSPs in the driving neurite was proportional to the value of the coupling resistance. In contrast, synaptic currents arriving at the coupled neurite through the electrical synapse produced EPSPs of constant amplitude. This was because the coupling resistance value had inverse effects on the amount of current arriving and on the impedance of the neurite. We propose that by modulating the amplitude of EPSPs, electrical synapses could regulate the firing frequency of neurons.


Figures

FIGURE 1
FIGURE 1
Electrical activity of Retzius neurons. (A) Nomarski image of a leech ganglion showing the somata of the pair of electrically coupled Retzius neurons (R). Arrow points anterior. Scale bar = 100 μm. (B) Simultaneous recordings from both Retzius neurons in one ganglion. V1 and V2 are the voltage recordings from each neuron. Synchronous action potentials (large truncated spikes) and EPSPs (small spikes) composed the spontaneous electrical activity pattern of these neurons. (C) Superposition of pairs of EPSPs recorded simultaneously from both neurons. The EPSPs boxed are amplified in C1 and C2. (C1) The amplitudes of EPSPs varied from one EPSP to the next and from one neuron to the other, although their rise and decay times were similar, suggesting presynaptic variations of transmitter release. (C2) Upon transmission failures onto either of the neurons, EPSPs produced in the other neuron could be recorded from both somata. EPSPs arriving from the coupled neuron (marked as V2) were slower and were also attenuated in amplitude. (D) Action potentials were produced by summation of EPSPs produced locally with those arriving from the coupled neuron (arrow). The following EPSPs produced an action potential in V1 (truncated spike), which was followed by another action potential in the coupled neuron.
FIGURE 2
FIGURE 2
Morphology of Retzius neurons. (A) Three-dimensional confocal reconstruction of a pair of Retzius neurons. The green neuron was filled with Texas red, and the purple neuron was filled with lucifer yellow. Images were not deconvolved. Scale = 40 μm. (B) Deconvolved partial (10 μm depth) reconstruction of the arborization of a Retzius neuron (blue). The contact sites are digitally superimposed (pink). Scale = 15 μm. (C) Confocal images of fluorescent beads of 0.5 (green) and 2.0 (red) μm diameters. Image on top was before deconvolution. The images in the middle and bottom were deconvolved with 20 and 50 iterations, respectively. Scale = 2.0 μm. (D) Partial reconstruction of a Retzius neuron. The area of contact is surrounded by the red lines. Neurites without branches are the continuous lines, and neurites with branches are the dotted lines. Scale = 40 μm. (E) Reconstruction of a Retzius neuron from confocal z series of deconvolved images. The yellow spots are contact sites digitally superimposed. Note that contact sites were restricted to an area proximal to the soma. Scale = 40 μm.
FIGURE 3
FIGURE 3
Electrical model of a pair of Retzius neurons. The somata, which were isopotential with the large primary axons, are represented as circuits with parallel resistance (rs) and capacitance (cs). Each soma is connected to neurites, one of which is represented as a finite cable of length ℓ and space constant λ. The electrotonic distance of the neurites is defined as ℓ/λ. Neurites from both neurons are connected by a coupling resistance (rc).
FIGURE 4
FIGURE 4
Estimates of the somatic time constant and membrane area. (A) Phase contrast image of the soma of a Retzius neuron in culture. (B) The time constant of neurons in culture was measured from the exponential decay time of the voltage response to the injection of square hyperpolarizing current pulses. The time constant was similar before (1) and after (2) a second electrode had impaled the neuron, showing that the soma “shunt” effect was minimal. The artifacts in trace 1 are due to bridge balance and show the beginning and end of the current pulse. (C) Electron micrograph of the soma of a Retzius neuron in culture showing invaginations of the plasma membrane. The nucleus (N) can also be seen. (D) Higher magnification of the region boxed in C.
FIGURE 5
FIGURE 5
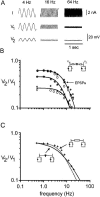
Frequency responses of neurons and model. (A) Sine wave currents (I) of different frequencies (top traces) injected into the soma of a Retzius neuron and voltage responses in the driving (V1) and coupled (V2) neurons. The amplitude and phase shift of the voltage responses of both neurons were frequency dependent. (B) Responses of six pairs of neurons with steady-state coupling ratios between 0.62 and 0.26 are presented with different symbols. The continuous lines are best fits of these responses with the predictions of the model shown in the inset. The parameter values used are in Table 1. (C) The two extreme conditions of the model shown in the insets failed to fit with the experimental data.
FIGURE 6
FIGURE 6
Effect of coupling resistance in the spread of EPSPs. Computer simulations reproduced the spread of artificial EPSPs from the soma of the driving neuron (V1) to the soma of the coupled neuron (V2) . Changing the coupling resistance value in the simulations from 15 to 30 and 80 MΩ modified the amplitude but not the shape of the EPSPs in V2.
FIGURE 7
FIGURE 7
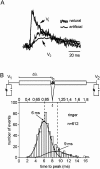
Location of synaptic inputs. (A) The coupling ratio of artificial EPSPs produced in the soma (V1) was smaller than the coupling ratio of natural EPSPs produced in one of the neurons showing that synaptic inputs were in the coupled neurites. (B) The model simulations were combined with the rise time distributions of EPSPs to predict the locations of the inputs along the coupled neurites. The rise time distributions of natural EPSPs recorded in the soma of one of the neurons (V1) had two Gaussian peaks, suggesting two major input domains. By adjusting the ℓ/λ coefficient, the model translated the rise time distributions to equivalent electrotonic distances equidistant from the electrical synapse (top scale). The distance from the electrical synapse to the presynaptic chemical inputs was 0.15 ℓ (7.5 μm).
FIGURE 8
FIGURE 8
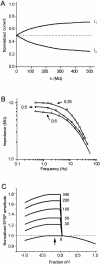
Modulation of the EPSP amplified by electrical synapses. (A) Model predictions for the distribution of synaptic current on both sides of the electrical synapse as a function of the coupling resistance value. I1 is the current in the driving neurite, and I2 is the current in the coupled neurite. The asymmetry of the curves is due to the location of the presynaptic chemical input at 0.15 ℓ from the electrical synapse. Currents were normalized to those when the rc = 0 MΩ. (B) Reciprocal relationship between the frequency-dependent impedance (Z = V1/I) and the steady-state coupling ratio. Symbols represent experimental measurements taken from neurons with coupling ratios of 0.25, 0.50, and 0.6. The lines were traced freehand after the data points were obtained. (C) The amplitude of EPSPs (arrow) depended on the value of the coupling resistance. The horizontal axis is the distance along both coupled neurites, assuming that (ℓ = 0) is the electrical synapse and that the somata are connected at distances ℓ = −1 (driving neuron) and ℓ = 1 (coupled neuron). The origin of EPSPs was at a distance ℓ = −0.15 (arrow). The amplitude of EPSPs was normalized to that when rc = 0. The amplitude of the EPSP produced in the coupled neurite from current produced in the driving neurite was the same for all of the coupling resistance values. The decay of EPSPs along the neurites had the same Gaussian shape for all of the coupling resistance values.
FIGURE 9
FIGURE 9
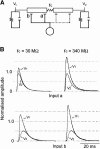
Effect of coupling resistance and input location on EPSPs arriving at both somata. (A) Diagram of the circuit with two presynaptic inputs at 0.15 and 0.85 ℓ from the electrical synapse. (B) Simulations of EPSPs produced by Input a (top) and Input b (bottom), arriving at both somata are superimposed. The coupling resistance values used were 30 (left) and 340 MΩ (right). The amplitudes were normalized to those of EPSPs produced when rc = 0 MΩ.

References

    1. Auerbach, A. A., and M. V. L. Bennett. 1969. A rectifying electrotonic synapse in the central nervous system of a vertebrate. J. Gen. Physiol. 53:211–237. - PMC - PubMed
    1. Baker, R., and R. Llinás, R. 1971. Electrotonic coupling between neurones in the rat mesencephalic nucleus. J. Physiol. (London) 212:45–63. - PMC - PubMed
    1. Bennett, M. V. L., E. Aljure, Y. Nakajima, and G. D. Pappas. 1963. Electrotonic junctions between teleost spinal neurons: electrophysiology and ultrastructure. Science. 141:262–264. - PubMed
    1. Bloomfield, S. A., J. E. Hamos, and S. M. Sherman. 1987. Passive cable properties and morphological correlates of neurones in the lateral geniculate nucleus of the cat. J. Physiol. 383:653–692. - PMC - PubMed
    1. Bras, H., P. Gogan, and S. Tyc-Dumont. 1987. The dendrites of single brain-stem motoneurons intracellularly labeled with horseradish peroxidase in the cat. Morphological and electrical differences. Neuroscience. 22:947–970. - PubMed

LinkOut - more resources