Comparative Study
. 2004 Jan;164(1):35-42.
doi: 10.1016/S0002-9440(10)63093-3.

Measurement of gene expression in archival paraffin-embedded tissues: development and performance of a 92-gene reverse transcriptase-polymerase chain reaction assay

Affiliations
Comparative Study

Measurement of gene expression in archival paraffin-embedded tissues: development and performance of a 92-gene reverse transcriptase-polymerase chain reaction assay

Maureen Cronin et al. Am J Pathol. 2004 Jan.

Abstract

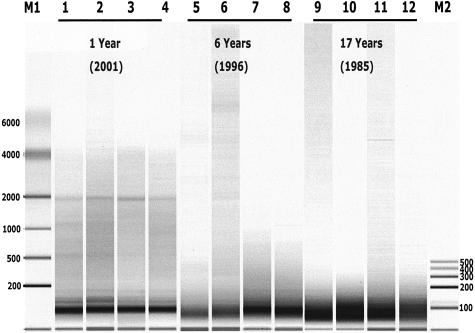
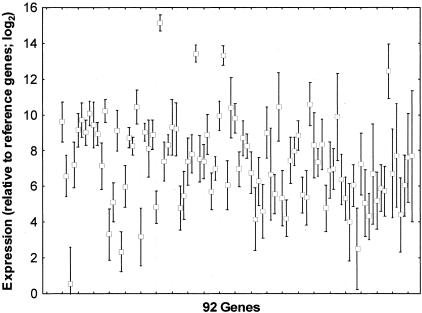
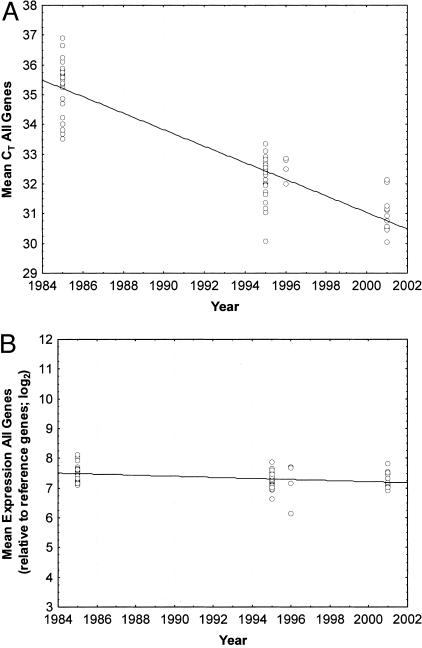
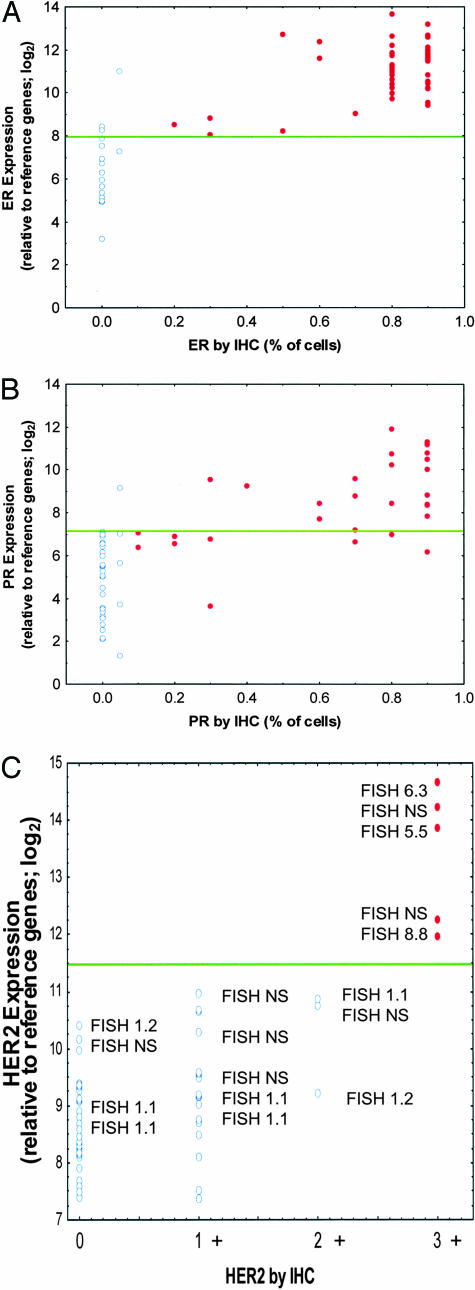
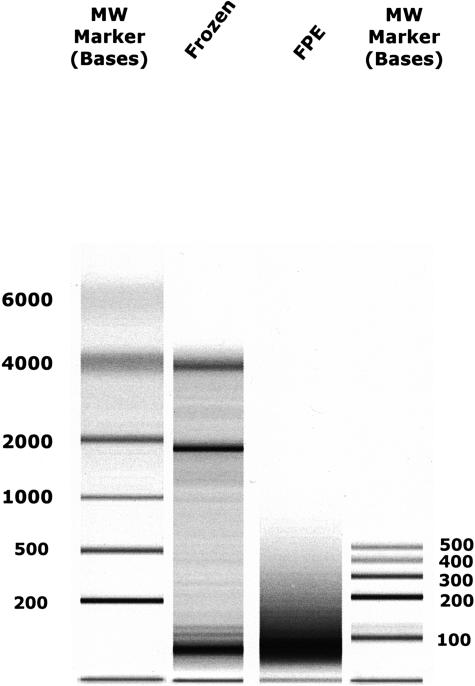
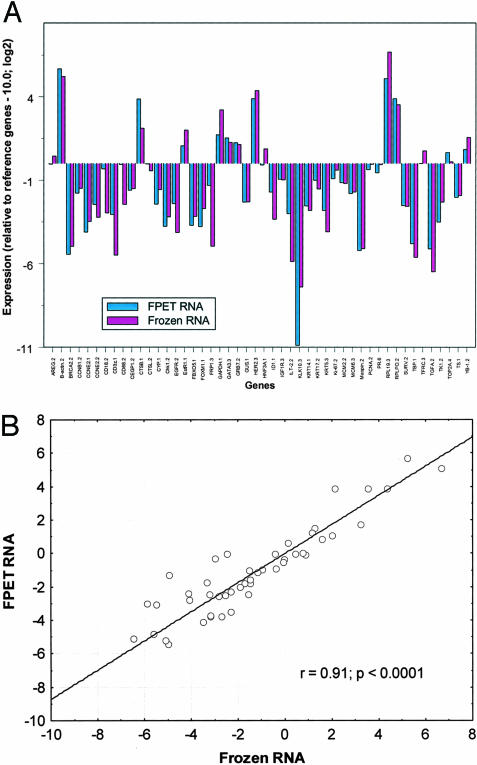
Throughout the last decade many laboratories have shown that mRNA levels in formalin-fixed and paraffin-embedded (FPE) tissue specimens can be quantified by reverse transcriptase-polymerase chain reaction (RT-PCR) techniques despite the extensive RNA fragmentation that occurs in tissues so preserved. We have developed RT-PCR methods that are sensitive, precise, and that have multianalyte capability for potential wide use in clinical research and diagnostic assays. Here it is shown that the extent of fragmentation of extracted FPE tissue RNA significantly increases with archive storage time. Probe and primer sets for RT-PCR assays based on amplicons that are both short and homogeneous in length enable effective reference gene-based data normalization for cross comparison of specimens that differ substantially in age. A 48-gene assay used to compare gene expression profiles from the same breast cancer tissue that had been either frozen or FPE showed very similar profiles after reference gene-based normalization. A 92-gene assay, using RNA extracted from three 10- micro m FPE sections of archival breast cancer specimens (dating from 1985 to 2001) yielded analyzable data for these genes in all 62 tested specimens. The results were substantially concordant when estrogen receptor, progesterone receptor, and HER2 receptor status determined by RT-PCR was compared with immunohistochemistry assays for these receptors. Furthermore, the results highlight the advantages of RT-PCR over immunohistochemistry with respect to quantitation and dynamic range. These findings support the development of RT-PCR analysis of FPE tissue RNA as a platform for multianalyte clinical diagnostic tests.


Figures

Figure 1
Figure 1
Size distribution of FPE tissue RNA from 12 tumor specimens. Total RNA was extracted from breast cancer specimens as described in Materials and Methods. One μl from each RNA extract (1/30 of the sample) was analyzed using an Agilent 2100 Bioanalyzer, RNA 6000 Nanochip. Lanes 1–4, 5–8, and 9–12 contain RNA from samples archived 1, 6, and 17 years, respectively. Lanes M1 and M2 contain two different sets of molecular weight marker RNA (sizes denoted in bases).
Figure 2
Figure 2
Expression ranges for 92 genes in 62 breast cancer specimens. TaqMan RT-PCR was used to measure mRNA levels as described in Materials and Methods, and expression relative to six reference genes. The mean and mean SD of the expression values across all tested patients is shown for each gene. Each box represents the mean mRNA level for all tested tumor specimens and the error bars indicate the SD of all measurements for that gene. Expression values (y axis) are normalized relative to the reference genes expressed as log base 2 values.
Figure 3
Figure 3
A and B: Mean CT values for 92 genes in 62 patient samples as a function of paraffin block archive storage time. The x axis shows the year each specimen was archived. The y axis shows mean expression values for all tested genes. Each symbol represents a separate patient. A: Raw mean CT expression values for all specimens. B: Expression values after normalization relative to six reference genes, as described in Materials and Methods. Reference genes were β-ACTIN, CYP1, GUS, RPLPO, TBP, and TFRC. Lines: Linear regression best fit.
Figure 4
Figure 4
A–C: RT-PCR compared with IHC and FISH assays for ER, PR, and HER2 in 62 FPE breast tumors. The RT-PCR expression data from the 92-gene assay of 62 patient specimens are normalized relative to the reference genes and presented on a log base 2 scale. IHC and FISH assays were performed by an independent diagnostics reference laboratory. The RT-PCR and IHC/FISH laboratories were each blinded with respect to the data generated by the other laboratory at the time the analyses were performed. In each panel, normalized expression values are on the y axis and the IHC or FISH scores are on the x axis. A: Normalized ER expression compared with percentage of cells scored as ER+ by IHC. Open circles are ER− by IHC and filled circles are IHC ER+. Expression scores above ∼28.0 are ER+ and below are ER−. B: Normalized PR expression compared with percentage of cells scored as PR+ by IHC. Open circles are PR− by IHC and filled circles are IHC PR+. Expression scores above ∼27.2 are PR+ and below are PR−. C: Normalized HER2 expression compared with IHC scoring (0 to +3 scale). Open circles are HER2-negative and filled circles are HER2-positive. Expression scores above ∼211.5 are HER2+ and below are HER2−. FISH scores are noted for each case tested. NS, FISH was not scored.
Figure 5
Figure 5
RNA size analysis of paired frozen and FPE tissue RNAs. Total RNA was extracted from frozen and FPE tissue specimens as described in Materials and Methods then analyzed for size profile using an Agilent 2100 Bioanalyzer, RNA 6000 Nanochip. One μl from each RNA preparation (1/30 of the sample) was analyzed. Lanes 2 and 3 contain frozen and FPE RNA, respectively, from the same breast tumor (from a 1995 surgery). Lanes M1 and M2 contain different sets of molecular weight RNAs (band sizes denoted in bases).
Figure 6
Figure 6
A–B: Comparison of RT-PCR expression profiles of 48 genes from paired frozen and FPE tissue RNAs. A: RNA was extracted from the frozen and FPET specimens and mRNA levels were determined by TaqMan quantitative RT-PCR as described in Materials and Methods. Results are plotted in a bar graph. Each bar represents normalized expression relative to the reference genes, and the mean of three measurements. B: Pearson correlation for all 48 genes between the two tissue preparation methods is 0.91.

References

    1. Rupp GM, Locker J. Purification and analysis of RNA from paraffin-embedded tissues. Biotechniques. 1988;6:56–60. - PubMed
    1. Finke J, Fritzen R, Ternes P, Lange W, Dolken G. An improved strategy and a useful housekeeping gene for RNA analysis from formalin-fixed, paraffin-embedded tissues by PCR. Biotechniques. 1993;14:448–453. - PubMed
    1. Reichmuth C, Markus MA, Hillemanns M, Atkinson MJ, Unni KK, Saretzki G, Hofler H. The diagnostic potential of the chromosome translocation t(2;13) in rhabdomyosarcoma: a PCR study of fresh-frozen and paraffin-embedded tumour samples. J Pathol. 1996;180:50–57. - PubMed
    1. Stanta G, Bonin S. RNA quantitative analysis from fixed and paraffin-embedded tissues: membrane hybridization and capillary electrophoresis. Biotechniques. 1998;24:271–276. - PubMed
    1. Sheils OM, Sweeney EC. TSH receptor status of thyroid neoplasms—TaqMan RT-PCR analysis of archival material. J Pathol. 1999;188:87–92. - PubMed

Publication types