. 2004 Jan 6;101(1):8-13.
doi: 10.1073/pnas.2536799100. Epub 2003 Dec 26.

Hubble's diagram and cosmic expansion

Affiliations

Hubble's diagram and cosmic expansion

Robert P Kirshner. Proc Natl Acad Sci U S A. .

Abstract

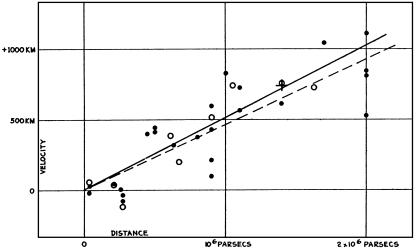
Edwin Hubble's classic article on the expanding universe appeared in PNAS in 1929 [Hubble, E. P. (1929) Proc. Natl. Acad. Sci. USA 15, 168-173]. The chief result, that a galaxy's distance is proportional to its redshift, is so well known and so deeply embedded into the language of astronomy through the Hubble diagram, the Hubble constant, Hubble's Law, and the Hubble time, that the article itself is rarely referenced. Even though Hubble's distances have a large systematic error, Hubble's velocities come chiefly from Vesto Melvin Slipher, and the interpretation in terms of the de Sitter effect is out of the mainstream of modern cosmology, this article opened the way to investigation of the expanding, evolving, and accelerating universe that engages today's burgeoning field of cosmology.


Figures

Fig. 1.
Fig. 1.
Velocity–distance relation among extra-galactic nebulae. Radial velocities, corrected for solar motion (but labeled in the wrong units), are plotted against distances estimated from involved stars and mean luminosities of nebulae in a cluster. The black discs and full line represent the solution for solar motion by using the nebulae individually; the circles and broken line represent the solution combining the nebulae into groups; the cross represents the mean velocity corresponding to the mean distance of 22 nebulae whose distances could not be estimated individually. [Reproduced with permission from ref. (Copyright 1929, The Huntington Library, Art Collections and Botanical Gardens).]
Fig. 2.
Fig. 2.
Published values of the Hubble constant vs. time. Revisions in Hubble's original distance scale account for significant changes in the Hubble constant from 1920 to the present as compiled by John Huchra of the Harvard–Smithsonian Center for Astrophysics. At each epoch, the estimated error in the Hubble constant is small compared with the subsequent changes in its value. This result is a symptom of underestimated systematic errors.
Fig. 3.
Fig. 3.
The Hubble diagram for type Ia supernovae. From the compilation of well observed type Ia supernovae by Jha (29). The scatter about the line corresponds to statistical distance errors of <10% per object. The small red region in the lower left marks the span of Hubble's original Hubble diagram from 1929.
Fig. 4.
Fig. 4.
Hubble diagram for type Ia supernovae to z ≈ 1. Plot in astronomers' conventional coordinates of distance modulus (a logarithmic measure of the distance) vs. log redshift. The history of cosmic expansion can be inferred from the shape of this diagram when it is extended to high redshift and correspondingly large distances. Diagram courtesy of Brian P. Schmidt, Australian National University, based on data compiled in ref. .
Fig. 5.
Fig. 5.
Large scale structure inferred from galaxy redshifts. Each dot in this plot marks a galaxy whose distance is estimated from its redshift by using Hubble's Law. From the 2DF Galaxy Redshift Survey (24).
Fig. 6.
Fig. 6.
Deviations in the Hubble diagram. Each point in this plot shows the difference at each redshift between the measured apparent brightness and the expected location in the Hubble diagram in a universe that is expanding without any acceleration or deceleration. The blue points correspond to median values in eight redshift bins. The upward bulge at z ≈ 0.5 is the signature of cosmic acceleration. The hint of a turnover in the data at the highest redshifts, near z = 1, suggests that we may be seeing past the era of acceleration driven by dark energy back to the era of deceleration dominated by dark matter. From top to bottom, the plotted lines correspond to the favored solution, with 30% dark matter and 70% dark energy, the observed amount of dark matter (30%) but no dark energy, and a universe with 100% dark matter (from ref. 18).

References

    1. Hubble, E. P. (1929) Proc. Natl. Acad. Sci. USA 15, 168–173. - PMC - PubMed
    1. Bennett, C. L., Halpern, M., Hinshaw, G., Jarosik, N., Kogut, A., Limon, M., Meyer, S. S., Page, L., Spergel, D. N., Tucker, G. S., et al. (2003) Astrophys. J. Suppl. 148, 1–27.
    1. Burles, S., Nollett, K. M. & Turner, M. S. (2001) Astrophys. J. 552, L1–L5.
    1. Kirshner, R. P. (2003) Science 300, 1914–1918. - PubMed
    1. Kirshner, R. P. (2002) The Extravagant Universe: Exploding Stars, Dark Energy, and the Accelerating Cosmos (Princeton Univ. Press, Princeton).

LinkOut - more resources