. 2004 Jan 13;101(2):529-33.
doi: 10.1073/pnas.0306036101. Epub 2003 Dec 29.

The catalytic cycle of cytochrome c oxidase is not the sum of its two halves

Affiliations

The catalytic cycle of cytochrome c oxidase is not the sum of its two halves

Dmitry Bloch et al. Proc Natl Acad Sci U S A. .

Abstract

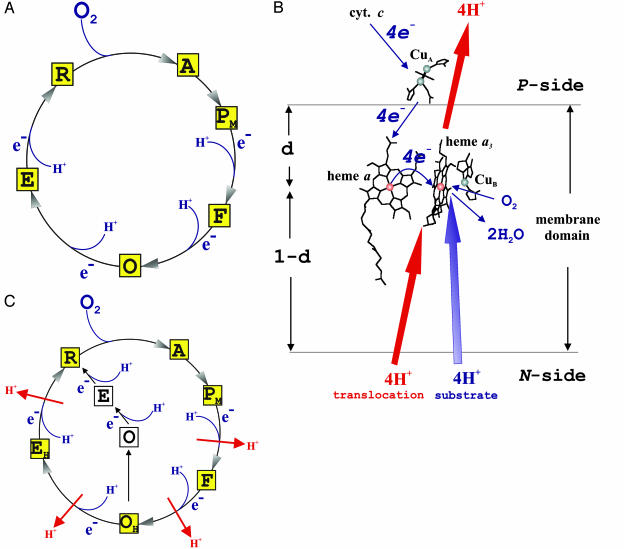
Membrane-bound cytochrome c oxidase catalyzes cell respiration in aerobic organisms and is a primary energy transducer in biology. The two halves of the catalytic cycle may be studied separately: in an oxidative phase, the enzyme is oxidized by O(2), and in a reductive phase, the oxidized enzyme is reduced before binding the next O(2) molecule. Here we show by time-resolved membrane potential and pH measurements with cytochrome oxidase liposomes that, with both phases in succession, two protons are translocated during each phase, one during each individual electron transfer step. However, when the reductive phase is not immediately preceded by oxidation, it follows a different reaction pathway no longer coupled to proton pumping. Metastable states with altered redox properties of the metal centers are accessed during turnover and relax when external electron donors are exhausted but recover after enzyme reduction and reoxidation by O(2). The efficiency of ATP synthesis might be regulated by switching between the two catalytic pathways.


Figures

Fig. 1.
Fig. 1.
Cytochrome c oxidase. (A) Conventional catalytic cycle. The squares show different states of the binuclear heme a3–CuB site and how electrons and substrate protons are taken up during activity. Proton translocation is not shown. (B) Overall reaction scheme and location of redox centers. Blue arrows show the redox reaction and its orientation with respect to the membrane. Red arrows depict proton translocation coupled to the redox reaction. The heme groups and CuB lie within the membrane at a relative dielectric depth d from the positively charged P surface. Electron transfer across d, proton consumption across 1-d, and proton pumping across the entire membrane contribute to generation of electric membrane potential (adapted from ref. 9). (C) Modified catalytic cycle. Yellow squares depict the main cycle. White squares show a side path initiated by decay of the metastable OH intermediate to O. Red arrows indicate proton translocation, and blue arrows show uptake of substrate protons. For details, see text.
Fig. 2.
Fig. 2.
Proton ejection during oxidation and rereduction of cytochrome c oxidase. Enzyme from bovine heart was reconstituted into phospholipid vesicles and reduced to different extents anaerobically by aliquots of ruthenium [II] hexaammine under conditions described in ref. . To start the reaction, O2 was added stoichiometric with the enzyme as a calibrated volume of air-saturated water, and the number of protons ejected from the vesicles was measured with a sensitive pH meter. Oxidation and rereduction of the enzyme were measured simultaneously by optical spectroscopy at 445–470 nm, from which the exact amount of reductant present was determined. The results of two independent series of experiments are shown (red and blue circles). The curve shows the result expected if one proton each is ejected during the P → F and F → OH transition (Fig. 1C), and if the OH → EH transition is associated with ejection of two protons and the EH → R transition with no protons (upper curve), or when both these transitions are associated with ejection of one proton (lower curve).
Fig. 3.
Fig. 3.
Membrane potential generation in cytochrome c oxidase vesicles. Experimental conditions for A–C (red and blue traces): 2 mM Hepes/4 mM Tris, pH 8/0.2 mM RuBiPy/10 mM aniline/50 mM glucose/3 mg/ml glucose oxidase/0.6 mg/ml catalase/trace amount of hexaammine ruthenium [III] chloride, 25°C. In B, 1 μM hexaammine ruthenium [III] chloride was also present. To remove trace amounts of oxygen and to achieve the fully reduced state of the enzyme, the samples were kept under 1% CO and 99% Ar atmosphere without access of air and with continuous stirring for 10–20 min before each measurement. A small volume of oxygen-saturated buffer was injected ≈1 s before the first laser flash (blue trace). In a second experiment, the first flash was followed by a train of flashes with 100-ms intervals (red traces), where each transient was recorded for 20 ms. These flashes caused photoinjection of electrons mediated by RuBiPy into the enzyme just oxidized by the first flash. Experiments were performed in the pH range 6–9 with essentially the same results. (A) Wild-type enzyme (integers below traces show flash number). (B) K354M mutant enzyme. (C) Magnified view of the response to the second flash in A (red trace) and B (blue trace). The green trace shows the response to the first flash of electron injection into fused proteoliposomes containing oxidized enzyme as isolated. Here the experimental conditions were as follows: air-saturated 2 mM Hepes/4 mM Tris, pH 8/0.08 mM RuBiPy/10 mM aniline. All three traces are normalized to the amplitude of the fast phase.

References

    1. Wikström, M. (1977) Nature 266, 271–273. - PubMed
    1. Chance, B., Saronio, C. & Leigh, J. S. (1975) Proc. Natl. Acad. Sci. USA 72, 1635–1640. - PMC - PubMed
    1. Babcock, G. T. & Wikström, M. (1992) Nature 356, 301–309. - PubMed
    1. Ferguson-Miller, S. & Babcock, G. T. (1996) Chem. Rev. 96, 2889–2907. - PubMed
    1. Proshlyakov, D. A., Pressler, M. A. & Babcock, G. T. (1998) Proc. Natl. Acad. Sci. USA 95, 8020–8025. - PMC - PubMed

Publication types

Substances

LinkOut - more resources