. 2004 Jan 5;199(1):113-24.
doi: 10.1084/jem.20030613. Epub 2003 Dec 29.

BH3-only protein Noxa is a mediator of hypoxic cell death induced by hypoxia-inducible factor 1alpha

Affiliations

BH3-only protein Noxa is a mediator of hypoxic cell death induced by hypoxia-inducible factor 1alpha

Jee-Youn Kim et al. J Exp Med. .

Abstract

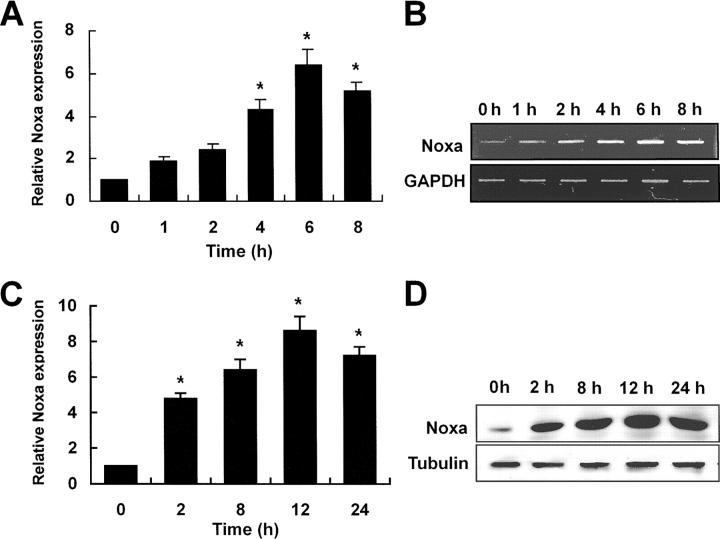
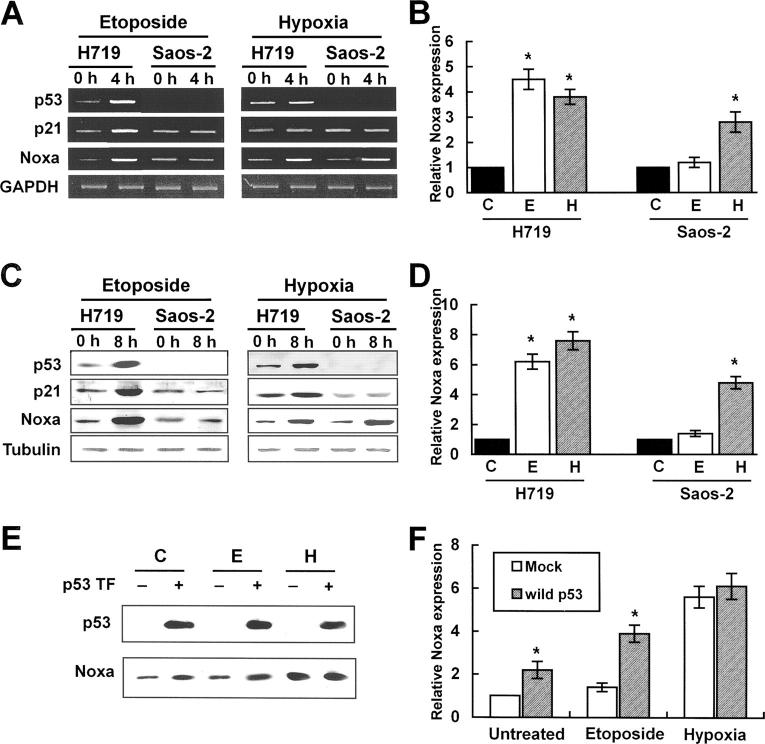
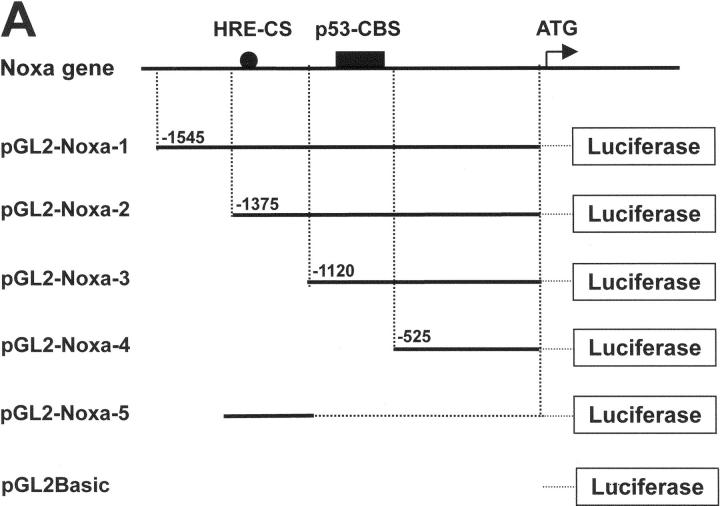
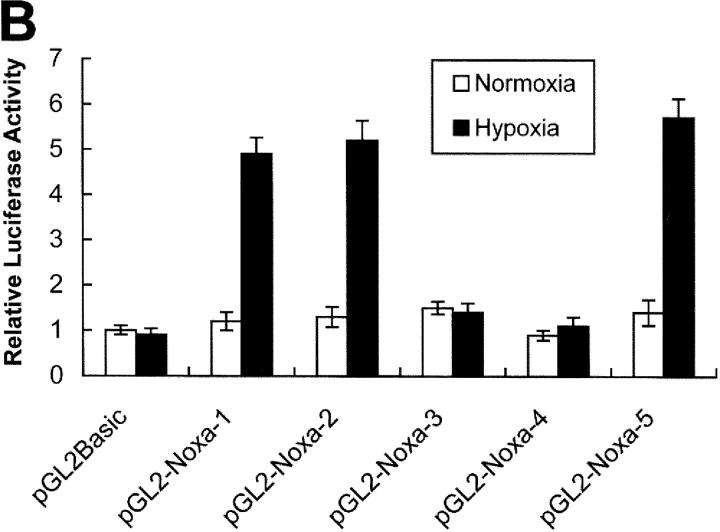
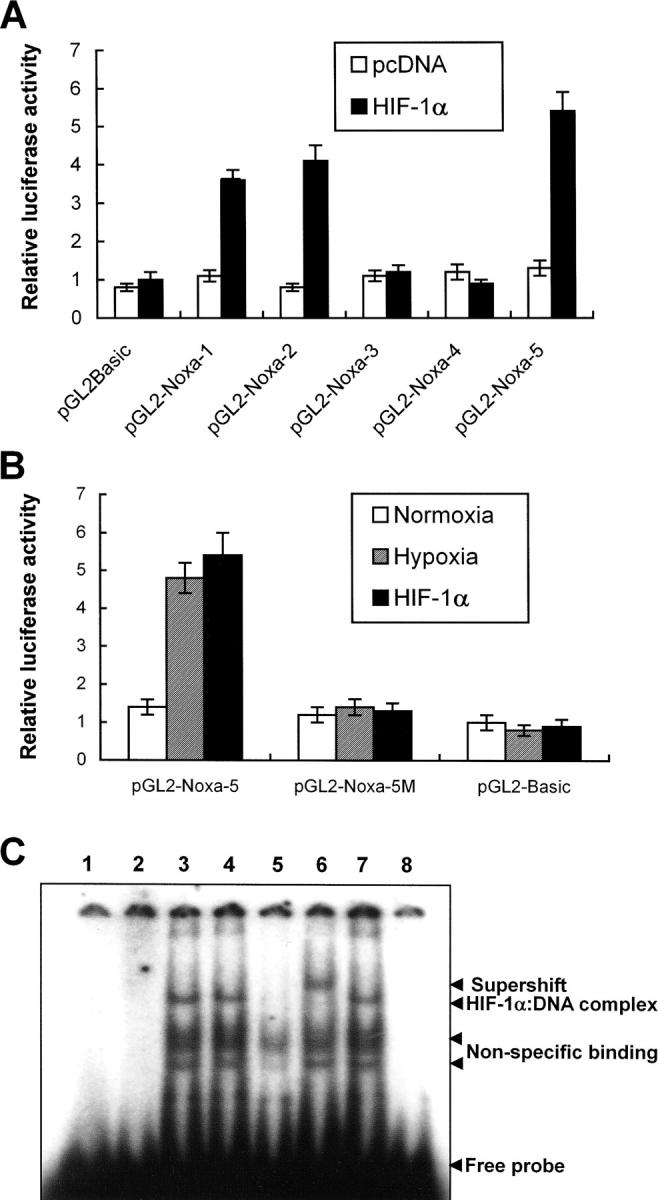
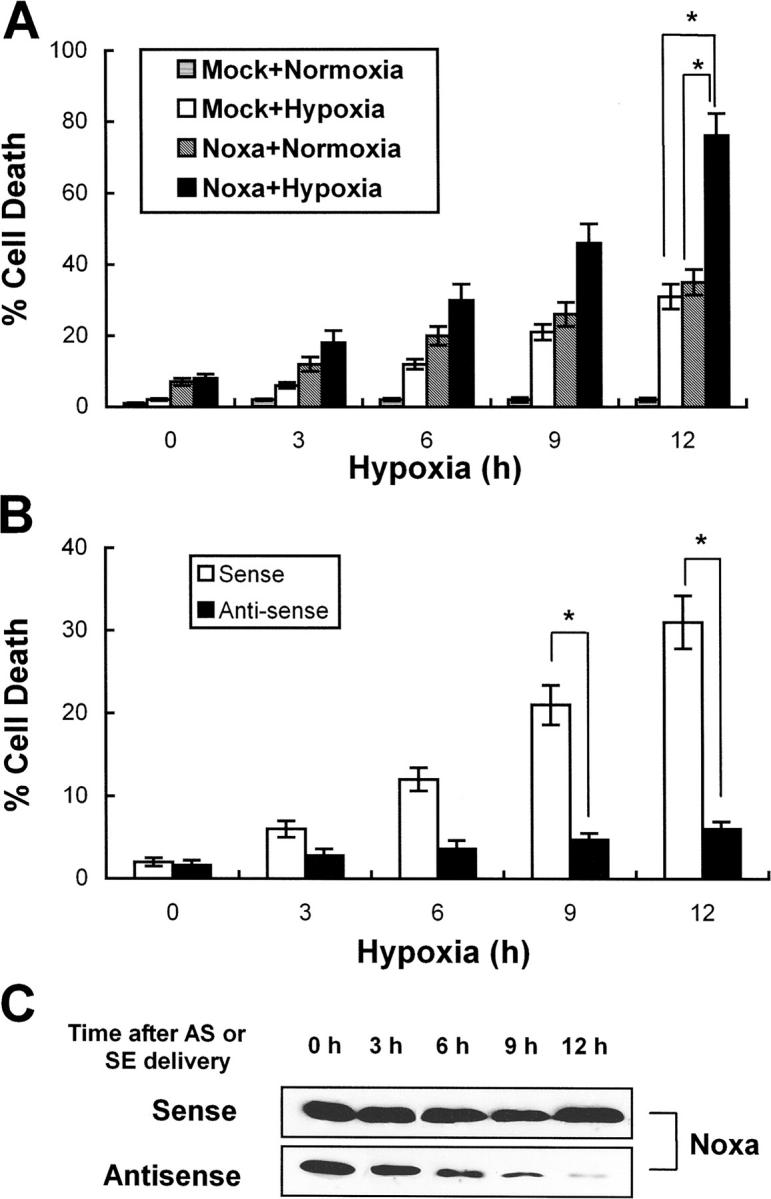
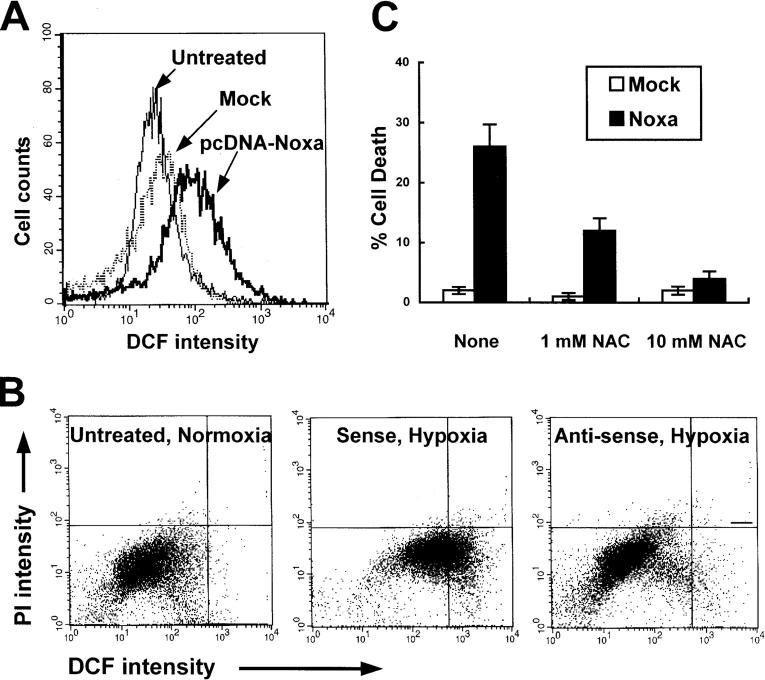
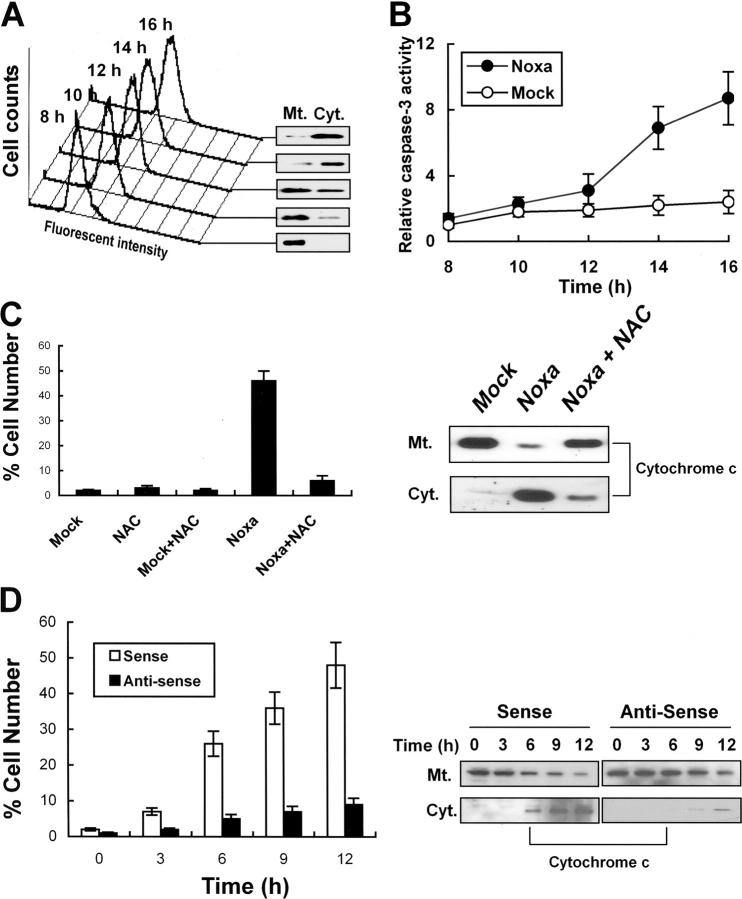
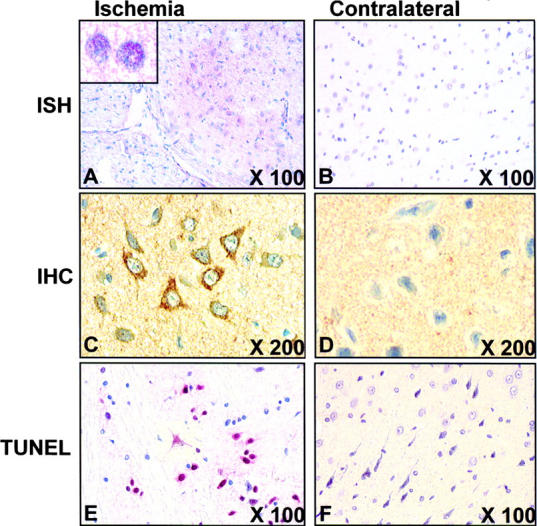
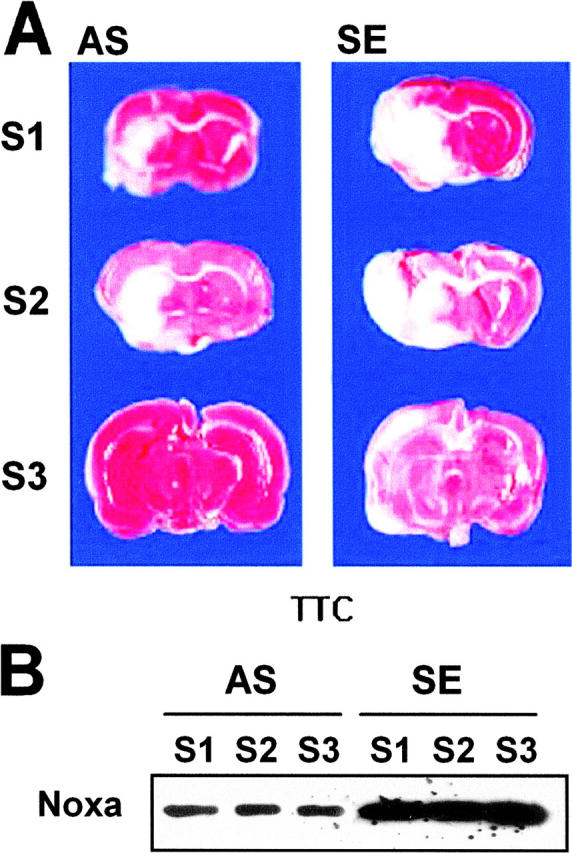
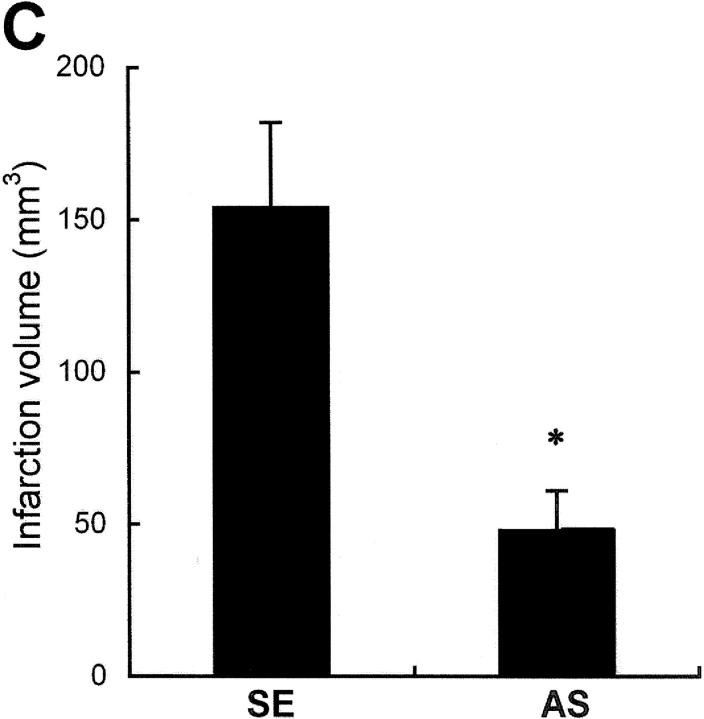
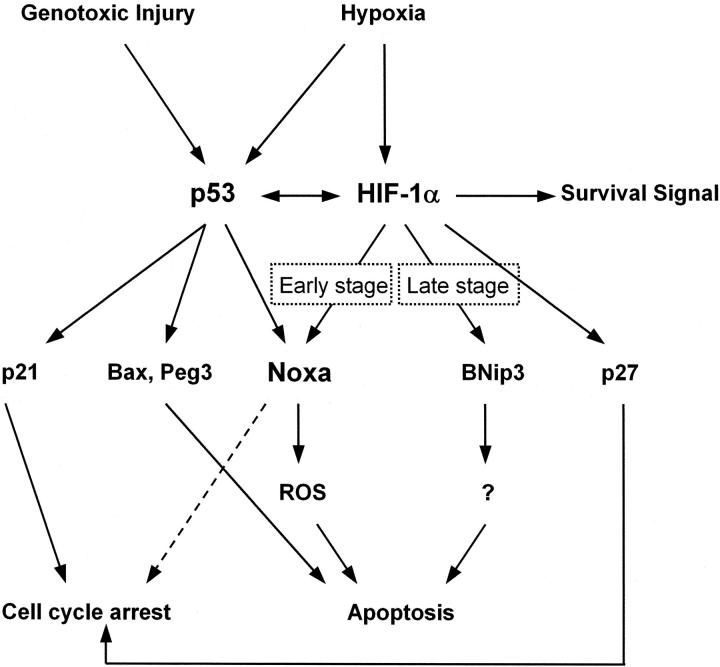
Hypoxia is a common cause of cell death and is implicated in many disease processes including stroke and chronic degenerative disorders. In response to hypoxia, cells express a variety of genes, which allow adaptation to altered metabolic demands, decreased oxygen demands, and the removal of irreversibly damaged cells. Using polymerase chain reaction-based suppression subtractive hybridization to find genes that are differentially expressed in hypoxia, we identified the BH3-only Bcl-2 family protein Noxa. Noxa is a candidate molecule mediating p53-induced apoptosis. We show that Noxa promoter responds directly to hypoxia via hypoxia-inducible factor (HIF)-1alpha. Suppression of Noxa expression by antisense oligonucleotides rescued cells from hypoxia-induced cell death and decreased infarction volumes in an animal model of ischemia. Further, we show that reactive oxygen species and resultant cytochrome c release participate in Noxa-mediated hypoxic cell death. Altogether, our results show that Noxa is induced by HIF-1alpha and mediates hypoxic cell death.


Figures

Figure 1.
Figure 1.
Hypoxia induces transcriptional and translational up-regulation of Noxa. SK-N-MC neuroblastoma cells in serum- and glucose-deficient medium were subjected to hypoxic condition (0.5% O2) for the indicated times. (A) cDNA was synthesized from the total RNAs extracted from SK-N-MC cells exposed to hypoxia and subjected to RT-PCR analysis. 32 and 26 cycles of amplification were performed for Noxa and GAPDH, respectively. Fold increases of Noxa expression (mean ± SD) were presented using densitometry. Noxa expression level at 0 h was arbitrarily defined as 1. *, a statistically significant difference in Noxa expression levels (P < 0.05 in A and C). (B) A representative RT-PCR result. (C) 30 μg cell lysates extracted from hypoxia-exposed cells were subjected to Western blot analysis using polyclonal anti-Noxa and β-tubulin antibodies. Fold increases of Noxa protein expression was presented. Noxa expression level at 0 h was arbitrarily defined as 1. (D) Representative Western blot.
Figure 2.
Figure 2.
Noxa is transcriptionally up-regulated by hypoxia in a p53-independent manner. H719 cells with wild-type p53 and p53-deleted Saos-2 cells were incubated with 10 μM etoposide or cultured under 0.5% O2 in serum- and glucose-deficient medium for the indicated times. (A) RT-PCR analysis. cDNA synthesized from total RNAs extracted from etoposide-treated or hypoxia-exposed cells were subjected to RT-PCR analysis for p53, p21, and Noxa. Quantitations of expression levels were achieved after adjustment for the expression levels of the housekeeping gene, GAPDH. The cycle numbers for amplification were 30 for p53, 32 for p21 and Noxa, and 26 for GAPDH. (B) Determination of relative Noxa mRNA expression was achieved by densitometric analysis (*, P < 0.05). Noxa expression level of normoxic cells was defined as 1. C, untreated normoxic; E, etoposide; H, hypoxia. (C) 30 μg cell lysates extracted from etoposide-treated or hypoxia-exposed cells were subjected to Western blot analysis using anti-p53, anti-p21, anti-Noxa, and β-tubulin antibodies. (D) Determination of relative Noxa protein expression was achieved by densitometric analysis (*, P < 0.05). Noxa expression level of normoxic cells was defined as 1. (E) Saos-2 cells were transiently transfected with 1 μg pcDNA-p53. After 24 h, cells were untreated or treated with etoposide or hypoxia for 8 h. Cell lysates were subjected to Western blot analysis using anti-p53 or anti-Noxa antibody. p53 TF, p53 transfection. (F) Determination of relative Noxa protein expression was achieved by densitometric analysis (*, P < 0.05). Noxa expression level of untreated normoxic cells with mock transfection was defined arbitrarily as 1.
Figure 3.
Figure 3.
Activation of Noxa promoter by hypoxia. (A) The Noxa promoter and various luciferase reporter constructs. HRE sites (closed circle) and p53-CBS (closed box) were shown. Numbering refers to the region of the Noxa promoter inserted into the parental pGL2Basic vector relative to the ATG translation initiation site as +1. (B) Saos-2 cells were transiently transfected with 1 μg indicated luciferase reporter plasmid. After 24 h of transfection, the cells were subjected to hypoxia for 6 h and then luciferase activity was determined. For each construct tested, fold increases of luciferase activities with hypoxia versus luciferase activity in normoxia (arbitrarily defined as 1) were presented. The mean ± SD of three independent experiments is shown.
Figure 3.
Figure 3.
Activation of Noxa promoter by hypoxia. (A) The Noxa promoter and various luciferase reporter constructs. HRE sites (closed circle) and p53-CBS (closed box) were shown. Numbering refers to the region of the Noxa promoter inserted into the parental pGL2Basic vector relative to the ATG translation initiation site as +1. (B) Saos-2 cells were transiently transfected with 1 μg indicated luciferase reporter plasmid. After 24 h of transfection, the cells were subjected to hypoxia for 6 h and then luciferase activity was determined. For each construct tested, fold increases of luciferase activities with hypoxia versus luciferase activity in normoxia (arbitrarily defined as 1) were presented. The mean ± SD of three independent experiments is shown.
Figure 4.
Figure 4.
Noxa promoter responds to hypoxia via HIF-1α. (A) Saos-2 cells were transiently cotransfected with 1 μg indicated luciferase report plasmid and pcDNA-HIF-1α or mock vector, and then cultured in normoxia. After 24 h of cotransfection, luciferase activities were determined. The values represent the average luciferase activity of three independent experiments. The bars indicate standard error. (B) Luciferase reporter plasmid containing a 256-bp fragment with one putative HRE of Noxa promoter, starting from −1,120 bp of ATG initiation codon, was constructed (pGL2-Noxa-5). Mutant form of pGL2-Noxa-5 was constructed by changing the core sequence of HRE (CGTG) to GCAC. Saos-2 cells were transiently transfected with the indicated luciferase reporter plasmid and exposed to hypoxia for 6 h, or cotransfected with pcDNA-HIF-1α. Luciferase activities were determined as described above. The mean ± SD of three independent experiments is shown. (C) EMSA and supershift analysis of human Noxa. Lane 1, 32P-Noxa oligonucleotide; lane 2, 32P-Noxa oligonucleotide and nuclear extracts from Saos-2 cells cultured in normoxia (NN); lane 3, 32P-consensus oligonucleotide and nuclear extracts from Saos-2 cells cultured in hypoxia (NH); lane 4, 32P-Noxa oligonucleotide and NH; lane 5, 32P-Noxa oligonucleotide and 100-fold excess of unlabeled cold Noxa oligonucleotide with NH; lane 6, 32P-Noxa oligonucleotide and anti–HIF-1α antibody with NH; lane 7, 32P-Noxa oligonucleotide and isotype control antibody with NH; lane 8, 32P mutant oligonucleotide and NH.
Figure 5.
Figure 5.
Noxa mediates cell death in response to hypoxia. (A) Saos-2 cells were transiently transfected with 1 μg pcDNA-Noxa or mock vector. After 18 h of transfection, cells were cultured in normoxic condition or subjected to hypoxia for the indicated time points. Dead cells were counted by trypan blue exclusion method (*, P < 0.05). (B) Saos-2 cells were treated with AS or SE oligonucleotides 6 h before hypoxic assault and then subjected to hypoxia for the indicated times. Dead cells were counted by the trypan blue exclusion test. The mean ± SD of three independent experiments is shown (*, P < 0.05). (C) Representative Western blot for Noxa after treatment with AS or SE.
Figure 6.
Figure 6.
ROS mediates Noxa-induced hypoxic cell death. (A) Saos-2 cells were transiently transfected with 1 μg pcDNA-Noxa or mock vector. After 16 h of transfection, cells were stained with DCF-DA and subjected to flow cytometric analysis. (B) The cells were untreated or treated with 20 μmol/liter SE or AS oligonucleotides before 4 h of hypoxic exposure, subjected to hypoxia for 3 h, and followed by reoxygenation for 1 h. The cells were double stained with PI and DCF-DA and analyzed by flow cytometry using CELLQuest™ software. (C) Saos-2 cells were transiently transfected with 1 μg pcDNA-Noxa or mock vector. After 16 h of transfection, cells were treated with or without NAC for an additional 12 h and cell death assay was performed using the trypan blue exclusion test.
Figure 7.
Figure 7.
Noxa induces ROS-dependent cytochrome c release in response to hypoxia. (A) Saos-2 cells were transiently transfected with 1 μg pcDNA-Noxa and change of ROS levels was sequentially determined at the indicated time point by flow cytometric analysis (left). Cytochrome c releases at the corresponding time points were determined by Western blot after cell fractionation (right). Mt., mitochondria; Cyt., cytoplasm. (B) Saos-2 cells were transiently transfected with 1 μg pcDNA-Noxa or mock and then caspase-3 activity was determined at the indicated time point. Caspase-3 activity of mock-transfected cells after 8 h of transfection was arbitrarily defined as 1. (C) Saos-2 cells were transiently transfected with 1 μg pcDNA-Noxa or mock vector. After 16 h of transfection, cells were treated with or without 10 mM NAC for an additional 8 h and cytochrome c release was determined by immunocytochemistry using anti–cytochrome c antibody. Percentage of cell numbers of three independent experiments with standard errors is presented (left). Representative Western blot for cytochrome c release after cell fractionation was presented (right). (D) Cells were treated with SE or AS oligonucleotides for 4 h, exposed to hypoxia for 3 h, and reoxygenated for an additional hour. Numbers of cells with released cytochrome c were counted at indicated time points (time was counted after 1 h of reoxygenation) and average percentages with standard errors are presented (left). Representative Western blot for cytochrome c after treatment with AS or SE is shown (right).
Figure 8.
Figure 8.
Expression of Noxa in ischemic rat brain from MCAO model. Brain was infarcted with MCA occlusion for 2 h, reperfused for 14 h, and then removed. Sections from infarcted or contralateral brain were (A) in situ hybridized with FITC-labeled cRNA probe (inset at high magnification) and (B) immunostained with anti-Noxa antibody or TUNEL stained. Fast Red substrate solution was used for chromagen in in situ hybridization and TUNEL method. DAB was used for immunostaining. Original magnifications are shown in each panel.
Figure 9.
Figure 9.
Protection of brain from ischemia by suppression of Noxa expression. SE or AS oligonucleotides (2 μg in 1 μl) were injected into the lateral ventricle 4 h before MCA occlusion for 2 h. Brain was reperfused for 14 h, removed, and then cut into eight coronal slices. (A) Representative section stained with triphenyl tetrazolium chloride (TTC). (B) Western blot analysis of Noxa from the corresponding slices of rat brain. (C) Infarction volume was calculated after measuring the infarct areas on coronal brain sections as described in Materials and Methods. The infarction volume of the control animal (SE) was 154.24 ± 28.38 mm3, whereas that of the experimental group (AS) was reduced to 48.86 ± 13.46 mm3 (*, P < 0.05).
Figure 9.
Figure 9.
Protection of brain from ischemia by suppression of Noxa expression. SE or AS oligonucleotides (2 μg in 1 μl) were injected into the lateral ventricle 4 h before MCA occlusion for 2 h. Brain was reperfused for 14 h, removed, and then cut into eight coronal slices. (A) Representative section stained with triphenyl tetrazolium chloride (TTC). (B) Western blot analysis of Noxa from the corresponding slices of rat brain. (C) Infarction volume was calculated after measuring the infarct areas on coronal brain sections as described in Materials and Methods. The infarction volume of the control animal (SE) was 154.24 ± 28.38 mm3, whereas that of the experimental group (AS) was reduced to 48.86 ± 13.46 mm3 (*, P < 0.05).
Figure 10.
Figure 10.
A schematic pathway of HIF-1α, p53, and their downstream effectors in apoptosis induced by hypoxic injury.

References

    1. Halterman, M.W., and H.J. Federoff. 1999. HIF-1α and p53 promote hypoxia-induced delayed neuronal death in models of CNS ischemia. Exp. Neurol. 159:65–72. - PubMed
    1. Bunn, H.F., and R.O. Poyton. 1996. Oxygen sensing and molecular adaptation to hypoxia. Physiol. Rev. 76:839–885. - PubMed
    1. Semenza, G.L. 1999. Regulation of mammalian O2 homeostasis by hypoxia-inducible factor 1. Annu. Rev. Cell Dev. Biol. 15:551–578. - PubMed
    1. Gardner, L.B., Q. Li, M.S. Park, W.M. Flanagan, G.L. Semenza, and C.V. Dang. 2001. Hypoxia inhibits G1/S transition through regulation of p27 expression. J. Biol. Chem. 276:7919–7926. - PubMed
    1. Semenza, G.L., and G.L. Wang. 1992. A nuclear factor induced by hypoxia via de novo protein synthesis binds to the human erythropoietin gene enhancer at a site required for transcriptional activation. Mol. Cell. Biol. 12:5447–5454. - PMC - PubMed

Publication types

MeSH terms