. 2004 Jan 5;199(1):81-90.
doi: 10.1084/jem.20031237. Epub 2003 Dec 29.

Toll-like receptors induce a phagocytic gene program through p38

Affiliations

Toll-like receptors induce a phagocytic gene program through p38

Sean E Doyle et al. J Exp Med. .

Abstract

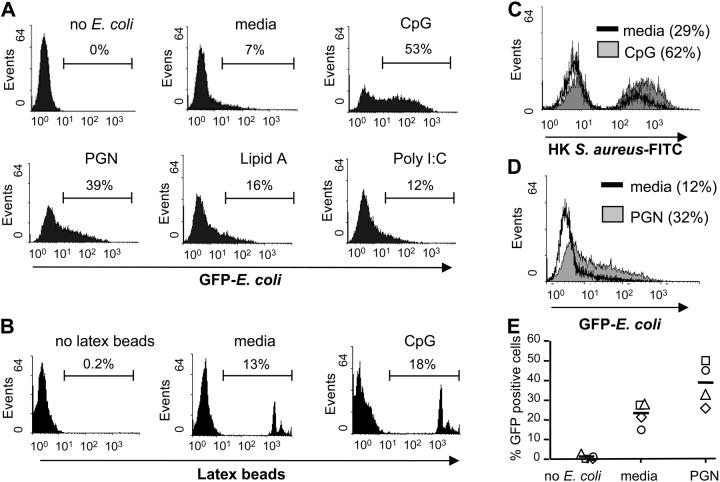
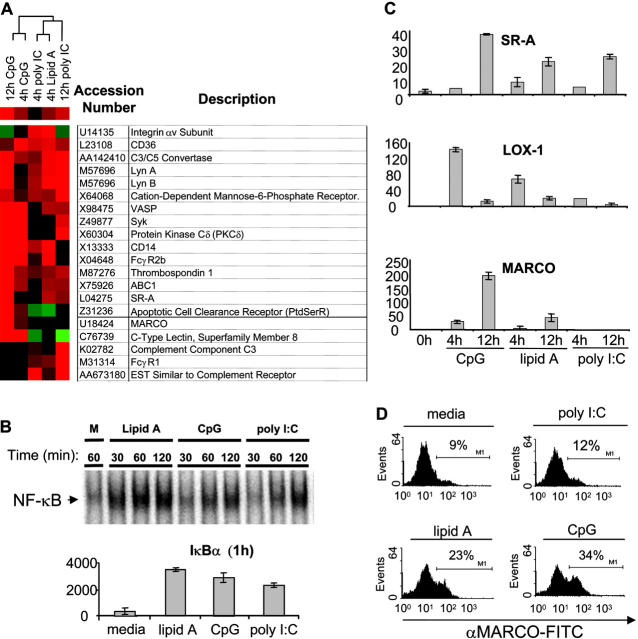
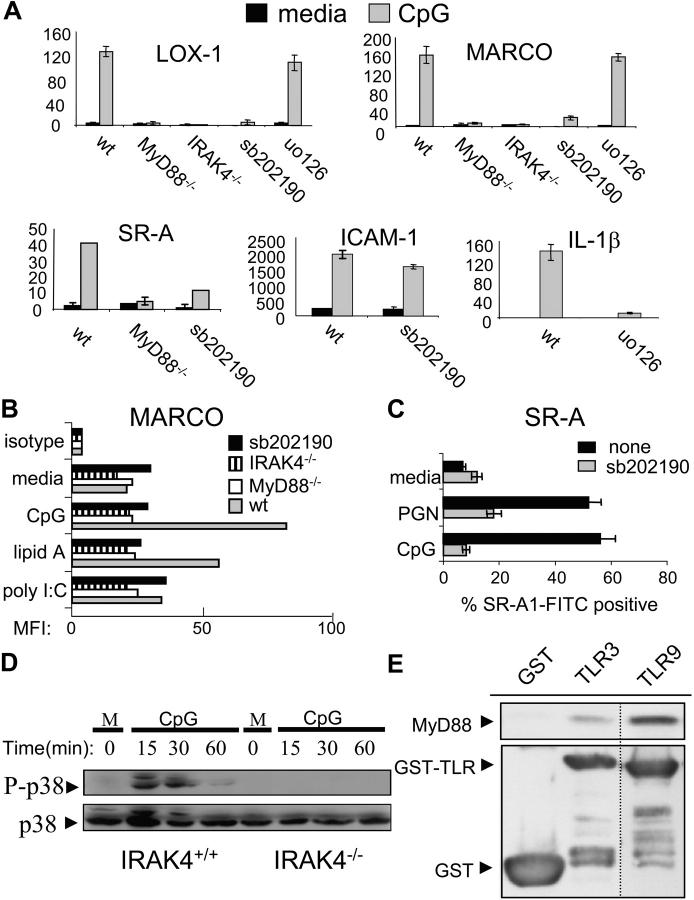
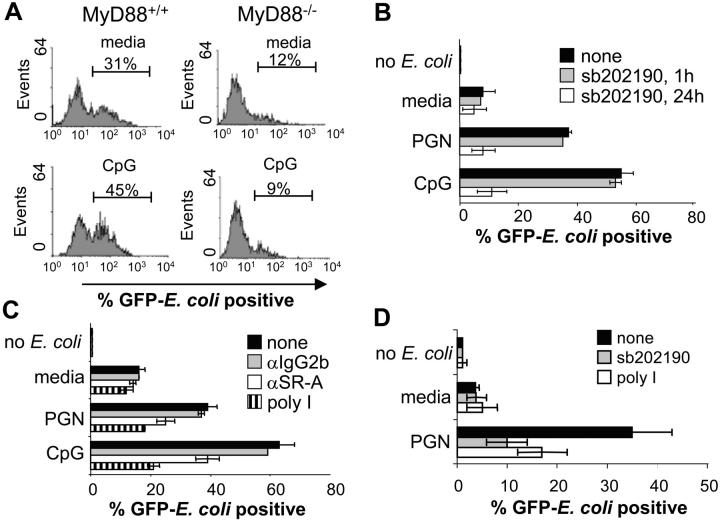
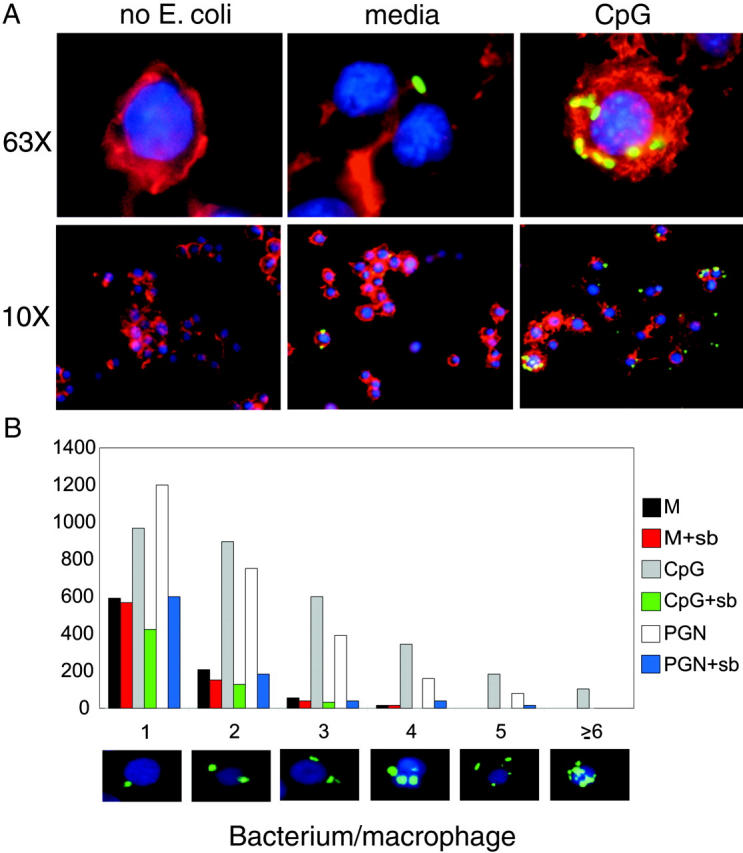
Toll-like receptor (TLR) signaling and phagocytosis are hallmarks of macrophage-mediated innate immune responses to bacterial infection. However, the relationship between these two processes is not well established. Our data indicate that TLR ligands specifically promote bacterial phagocytosis, in both murine and human cells, through induction of a phagocytic gene program. Importantly, TLR-induced phagocytosis of bacteria was found to be reliant on myeloid differentiation factor 88-dependent signaling through interleukin-1 receptor-associated kinase-4 and p38 leading to the up-regulation of scavenger receptors. Interestingly, individual TLRs promote phagocytosis to varying degrees with TLR9 being the strongest and TLR3 being the weakest inducer of this process. We also demonstrate that TLR ligands not only amplify the percentage of phagocytes uptaking Escherichia coli, but also increase the number of bacteria phagocytosed by individual macrophages. Taken together, our data describe an evolutionarily conserved mechanism by which TLRs can specifically promote phagocytic clearance of bacteria during infection.


Figures

Figure 1.
Figure 1.
TLR ligands specifically increase macrophage phagocytosis of bacteria. (A) RAW 264.7 macrophage cells were pretreated with media, CpG (100 nM), PGN (20 μg/ml), lipid A (50 ng/ml), or poly I:C (10 μg/ml) for 24 h and then challenged with GFP–E. coli at an MOI of 25. (B) RAW 264.7 cells pretreated with 100 nM CpG or media alone were treated with fluorescently labeled latex beads at an MOI of 1. (C) BODIPY®-conjugated S. aureus BioParticles® at an MOI of 10. (D) THP-1 monocytes were treated with media or PGN (20 μg/ml) for 36 h. Cells were then challenged with GFP–E. coli at an MOI of 5, and analyzed for the presence of phagocytosed bacteria. (E) Primary human monocytes were collected from four independent human donors (donor 1, square; donor 2, circle; donor 3, diamond; donor 4, triangle; mean, line) and subjected to the same phagocytosis experiments as in D. After microbial or particle challenge, cells were washed and subjected to FACS® analysis. All FACS® data are represented as percent positive cells. Data are representative of at least two independent experiments.
Figure 2.
Figure 2.
TLR ligands induce expression of genes involved in phagocytosis. Murine bone marrow–derived macrophage cells were stimulated with media (m), CpG (100 nM), lipid A (1 ng/ml), or poly I:C (1 μg/ml) for the indicated times. (A) Total RNA was collected after 4 or 12 h of TLR ligand stimulation and subjected to a microarray analysis as described in Materials and Methods. A subset of genes involved in phagocytosis is depicted as a dendrogram. Red represents up-regulation of the gene, black represents no change in expression, and green represents down-regulation of the gene. (B) Nuclear extract from each sample (2 μg) was used to assay inducible DNA binding of NF-κB by EMSA (top), or RNA was collected, converted to cDNA, and subjected to Q-PCR analysis to assay IκBα gene induction by 1 h (bottom). (C) Total RNA was collected from BMMs treated with indicated PAMPs, converted to cDNA, and Q-PCR was used to verify expression of MARCO, SR-A, and LOX-1 using sequence specific primers. (D) BMMs were stimulated with TLR ligands for 24 h and cells were stained with anti-MARCO–FITC antibody to detect MARCO via FACS®. The data are represented as percent-positive cells. Q-PCR data are represented in relative expression units and all values have been normalized to L32. All data, except the microarray, are representative of at least three independent experiments.
Figure 3.
Figure 3.
TLRs use a MyD88IRAK4p38 signaling pathway in order to induce expression of the SRs MARCO, LOX-1, and SR-A. (A) BMMs from MyD88−/−, IRAK4−/− mice, or wild-type BMMs pretreated with either sb202190 (sb, 10 μM) or uo126 (10 μM) were stimulated with media (m) or CpG (100 nM) for 4 or 12 h. Total RNA was collected, converted to cDNA, and then Q-PCR was used to assay the inducible expression of SR-A, LOX-1, and MARCO under the different conditions. To control for specificity of p38 and ERK 1/2 inhibition, induction of ICAM-1 and IL-1β were also measured. Q-PCR data are represented in relative expression units and normalized to L32. (B) Wild-type, MyD88−/−, IRAK4−/−, and sb202190 (10 μM) pretreated wild-type BMMs were stained for MARCO surface expression after 24 h of media, CpG (100 nM), lipid A (1 ng/ml), or poly I:C (1 μg/ml) treatment and FACS® data are represented as the mean fluorescent intensity (MFI) of each cell population. (C) RAW 264.7 cells were stimulated with CpG (100 nM) or PGN (20 μg/ml) for 24 h, either in the presence of absence or 10 μM sb202190, stained with a FITC-labeled αSR-A antibody, and then analyzed by FACS®. (D) BMMs from wild-type and IRAK4−/− mice were stimulated with media or CpG (100 nM) for the indicated times. Whole cell extract was then subjected to immunoblotting to detect phosphorylated (activated) p38 or total p38. (E) 293T cells were transfected with a MyD88 expression vector. Extract was collected and incubated with glutathione beads containing either TLR9 (intracellular domain)–GST, TLR3 (intracellular domain)–GST, or GST alone. Bound MyD88 was eluted by boiling and visualized by immunoblotting using an anti-MyD88 polyclonal antibody. The dashed line represents a cropping border where irrelevant lanes have been removed. Data are representative of at least two independent experiments.
Figure 4.
Figure 4.
TLR-induced phagocytosis of bacteria is MyD88, p38, and SR dependent. (A) BMMs derived from either wild-type or MyD88-deficient mice were stimulated with media or 100 nM CpG for 24 h followed by infection with GFP-expressing E. coli at an MOI of 10 for 45 min. Cells were washed twice with cold PBS and subjected to FACS® analysis. (B) RAW 264.7 macrophage cells were stimulated with media, CpG (100 nM), or PGN (20 μg/ml) for 24 h. Cells were cotreated with 10 μM sb202190 for the entire duration of the media, CpG or PGN pretreatment, or just for the final 1 h. Cells were then challenged with GFP–E. coli for 45 min at an MOI of 25, washed, and subjected to FACS® analysis. (C) RAW 264.7 cells were pretreated with either media, CpG (100 nM), or PGN (20 μg/ml) for 24 h. For the final 1 h, the cells were treated with poly I (100 μg/ml), anti–SR-A (3 μg/ml), or IgG2b isotype control (3 μg/ml) and phagocytosis assays were performed. (D) THP-1 monocytes were treated with media or PGN (20 μg/ml) for 36 h. The same conditions were also used along with sb202190 (10 μM) for 36 h or poly I (100 μg/ml) for the final 1 h of TLR ligand pretreatment. Cells were then challenged with GFP–E. coli at an MOI of 5, washed, and subjected to FACS® analysis. Data represent at least two independent experiments.
Figure 5.
Figure 5.
TLR activation results in an increase in the number of bacteria per individual macrophage. (A) RAW 264.7 cells were pretreated with media or CpG (100 nM) for 24 h, phagocytosis assays were performed using GFP–E. coli (green), and cells were fixed, stained with DAPI (blue) to stain chromosomal DNA and rhodamine-phalloidin (red) to stain cytoplasmic F-actin, and subjected to fluorescence microscopy at both 10× and 63× resolution. (B) The same cells as seen in A were subjected to LSC-based FISH analysis using the LSC to determine the number of GFP signals on a per cell basis. Data are represented as the number of macrophage cells (out of 5,000 scanned) that had either 1, 2, 3, 4, 5, or ≥6 GFP signals per cell. Pictures along the x axis are representative of macrophage cells in each grouping that were counted by the LSC. Data represent at least two independent experiments.

References

    1. Sansonetti, P. 2001. Phagocytosis of bacterial pathogens: implications in the host response. Semin. Immunol. 13:381–390. - PubMed
    1. Gordon, S. 2002. Pattern recognition receptors: doubling up for the innate immune response. Cell. 111:927–930. - PubMed
    1. Janeway, C.A., Jr., and R. Medzhitov. 2002. Innate immune recognition. Annu. Rev. Immunol. 20:197–216. - PubMed
    1. Akira, S., K. Takeda, and T. Kaisho. 2001. Toll-like receptors: critical proteins linking innate and acquired immunity. Nat. Immunol. 2:675–680. - PubMed
    1. Takeuchi, O., and S. Akira. 2001. Toll-like receptors: their physiological role and signal transduction system. Int. Immunopharmacol. 1:625–635. - PubMed

Publication types

MeSH terms