. 2004 Jan 5;199(1):69-80.
doi: 10.1084/jem.20031588. Epub 2003 Dec 29.

Essential role of survivin, an inhibitor of apoptosis protein, in T cell development, maturation, and homeostasis

Affiliations

Essential role of survivin, an inhibitor of apoptosis protein, in T cell development, maturation, and homeostasis

Zheng Xing et al. J Exp Med. .

Abstract

Survivin is an inhibitor of apoptosis protein that also functions during mitosis. It is expressed in all common tumors and tissues with proliferating cells, including thymus. To examine its role in apoptosis and proliferation, we generated two T cell-specific survivin-deficient mouse lines with deletion occurring at different developmental stages. Analysis of early deleting survivin mice showed arrest at the pre-T cell receptor proliferating checkpoint. Loss of survivin at a later stage resulted in normal thymic development, but peripheral T cells were immature and significantly reduced in number. In contrast to in vitro studies, loss of survivin does not lead to increased apoptosis. However, newborn thymocyte homeostatic and mitogen-induced proliferation of survivin-deficient T cells were greatly impaired. These data suggest that survivin is not essential for T cell apoptosis but is crucial for T cell maturation and proliferation, and survivin-mediated homeostatic expansion is an important physiological process of T cell development.


Figures

Figure 1.
Figure 1.
Generation of T cell–specific survivin-deficient mice. (A) A schematic diagram of the survivin gene locus and its various alleles. The targeting construct has three loxP sites (triangles) flanking the four survivin exons (boxes) and the neomycin gene. After selecting the cells with the appropriate targeting allele, the neomycin gene was removed by transfecting a cre-expressing plasmid. The survivin flox allele mice were then generated and crossed to lck-cre or CD4-cre according to the scheme described in Results, to generate lck-survivin– or CD4-survivin–deficient mice. K, KpnI; S, SacI; E, EcoRV. Horizontal arrows denote the approximate location of the oligonucleotides used for genotyping and analysis in C (Adv17, Adv25, and Adv28). (B) Southern blot and PCR analysis of the flox survivin allele. Left: Southern blot analysis of the ES cells containing loxP sites in the survivin locus. The DNAs were digested with a combination of KpnI and EcoRV and hybridized with a 5′ probe as depicted in A. The presence of a 14-kb band is indicative of the correct targeted allele. Right: PCR analysis of the resulting survivinflox/+ mice after the neomycin gene has been removed (3′ flox sites). (C) PCR analysis of the survivin-deleted allele in various T cell DN sub-populations. The different DN subpopulations were sorted based on their CD25 and CD44 expression: DN1 (CD44+ CD25), DN2 (CD44+ CD25+), DN3 (CD44 CD25+), DN4 (CD44 CD25). PCR analysis using three oligonucleotides (Adv17, Adv25, and Adv28 in A) flanking the survivin flox allele was conducted to analyze for the presence of the survivin flox allele (a 577-bp product of Adv25 and Adv28) or the deleted allele (a 420-bp of Adv17 and Adv28). (D) PCR analysis of the survivin-deleted allele in splenic CD4+ T cell populations. Splenic T cells were stained with anti-CD4 and CD8 antibodies and sorted by flow cytometry (99% pure) and subjected to PCR analysis as described in C above. (E) Western blot analysis of survivin expression in purified DP thymocytes. Two survivin isoforms were detectable in the wild-type thymocytes. C, cytoplasmic extracts; N, nuclear extracts. Western blotting using anti–α-tubulin antibodies was performed as a loading control.
Figure 2.
Figure 2.
Analysis of lck-survivin mice. (A) The absolute cell numbers of DN, DP, SP (CD4+ CD8 or CD8+ CD4), and peripheral T cells in lck-survivin mice and the littermate controls (n = 12). (B) CD4/CD8 ratio of thymocyte SP and peripheral T cells. (C) Left: CD4 versus CD8 flow cytometric analysis of lck-survivin thymocytes and the littermate controls. Middle: Flow cytometric analysis of lck-survivin thymocytes gated on CD4 CD8 DN cells. Numbers indicate the percentages of the corresponding populations. Right: Flow cytometric analysis of CD25+ DN thymocytes from lck-survivin and control thymocytes. Numbers indicate the percentages of the corresponding population. E, small cells; L, large cells.
Figure 3.
Figure 3.
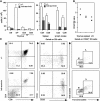
Analysis of CD4-survivin mice. (A) The absolute cell numbers of DN, DP, SP (CD4+ CD8 or CD8+ CD4), and peripheral T cells in 4–8-wk-old CD4-survivin mice and the littermate controls (n = 14). (B) CD4/CD8 ratio of thymocyte SP and peripheral T cells. (C) CD4 versus CD8 flow cytometric analysis of CD4-survivin thymocytes and the littermate controls. Numbers indicate the percentages of the corresponding T cell populations.
Figure 4.
Figure 4.
Reduced number of peripheral T cells in young mice and their elevated HSA level. (A) The absolute cell numbers of DP, SP (CD4+ CD8 or CD8+ CD4), thymocytes, and peripheral T cells in newborn CD4-survivin mice and the littermate controls (n = 5). (B) Representative flow cytometric profile of splenocytes from 0–1-wk-old CD4-survivin mice. The experiments have been repeated at least three times with similar findings. (C) CD8 versus HSA flow cytometric profile of peripheral T cells from CD4-survivin and control littermates. (D) Impaired CD25 activation marker in CD4-survivin peripheral T cells. Splenic cells from CD4-survivin mice and their littermate controls (WT) were stimulated with anti-CD3/CD28 antibodies for 18 h and stained with anti-CD4 and anti-CD25 antibodies. The CD4+ gated cell profiles are shown here.
Figure 5.
Figure 5.
Apoptosis proceeds normally in the absence of survivin. (A) Thymocytes from CD4-survivin and their littermate controls were incubated for 12 h in the absence of any stimuli or with anti-Fas antibody, dexamethasone (dex), or a combination of PMA phorbol ester and ionomycin (n = 4). Percent apoptotic cells were measured by staining with 7-AAD. The same experiments have been performed with annexin V with similar results. 0, unstimulated fresh thymocytes. (B) Percent thymocytes that were undergoing apoptosis were measured after 12, 24, or 48 h of incubation with 50 ng/ml soluble FasL recombinant protein (Qbiogene). Thymocytes were taken from CD4-survivin mice or their wild-type littermates (WT). (C) Percent apoptotic CD4 splenic T cells were measure by 7-AAD staining after 12 h of incubation in the absence (−) or presence of either 1 μM dexamethasone (dex), 10 μg/ml etoposide (ET), or a combination of anti-CD3/CD28 antibodies.
Figure 6.
Figure 6.
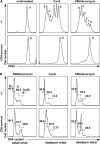
Defective cell cycle progression of survivin-deficient T cells. (A) CFSE incorporation of Con A or PMA/ionomycin-stimulated T cells from adult animals. Numbers indicate the number of cell divisions of stimulated T cells. (B) Propidium iodide staining of PMA/ionomycin or Con A–stimulated T cells from adult or newborn mice. The experiments have been repeated more than three times with similar results.
Figure 7.
Figure 7.
BrdU incorporation study of CD4-survivin–deficient mice. (A) BrdU labeling of SP thymocytes and peripheral T cells from CD4-survivin mice and their littermate (+/−) controls. Mice were injected intraperitoneally with BrdU and 3 h later flow cytometric analyses were conducted for the respective T cell populations: CD4 or CD8 SP thymocytes and spleen CD8+ cells. (B) Side and forward scatter analysis of CD4 or CD8 SP thymocytes from CD4-survivin and littermate (+/−) controls. The percentages of the large (L) cells are indicated. (C) Mice were injected with BrdU every 6 h in a 25-h period before their thymocytes were harvested and stained with either anti-CD4 or anti-CD8 antibodies followed by anti-BrdU antibodies and 7-AAD. The BrdU versus 7-AAD profiles of CD4 gated thymocytes, which include CD8+ CD4 SP and DN cells, are shown. Similar findings were also observed for CD8 gated thymocytes.

Similar articles

Cited by

References

    1. von Boehmer, H. 1994. Positive selection of lymphocytes. Cell. 76:219–228. - PubMed
    1. Sohn, S.J., A. Rajpal, and A. Winoto. 2003. Apoptosis during lymphoid development. Curr. Opin. Immunol. 15:209–216. - PubMed
    1. Ceredig, R. 1990. Intrathymic proliferation of perinatal mouse alpha beta and gamma delta T cell receptor-expressing mature T cells. Int. Immunol. 2:859–867. - PubMed
    1. Ernst, B., C.D. Surh, and J. Sprent. 1995. Thymic selection and cell division. J. Exp. Med. 182:961–971. - PMC - PubMed
    1. Krammer, P.H. 2000. CD95's deadly mission in the immune system. Nature. 407:789–795. - PubMed

Publication types