. 2004 Jan;24(2):537-49.
doi: 10.1128/MCB.24.2.537-549.2004.

BASP1 is a transcriptional cosuppressor for the Wilms' tumor suppressor protein WT1

Affiliations

BASP1 is a transcriptional cosuppressor for the Wilms' tumor suppressor protein WT1

Brian Carpenter et al. Mol Cell Biol. 2004 Jan.

Abstract

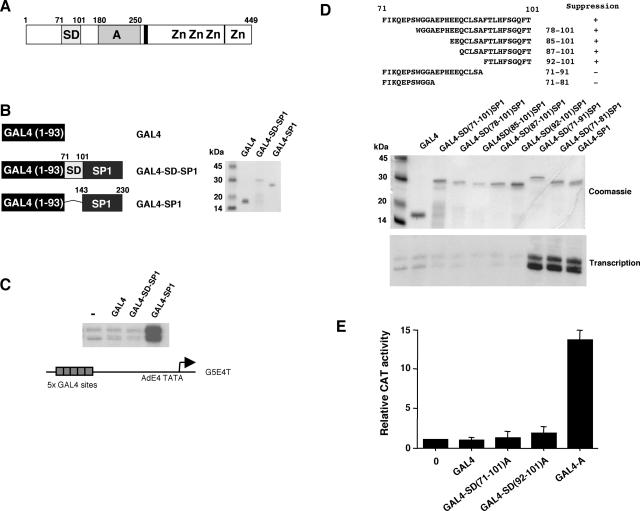
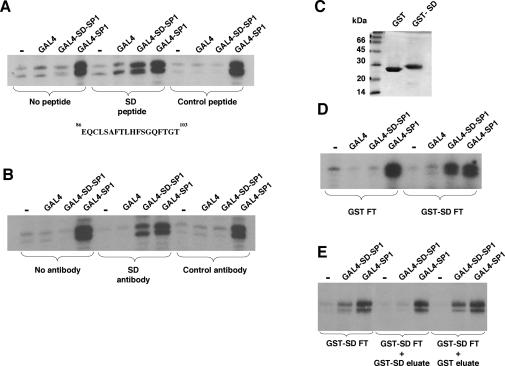
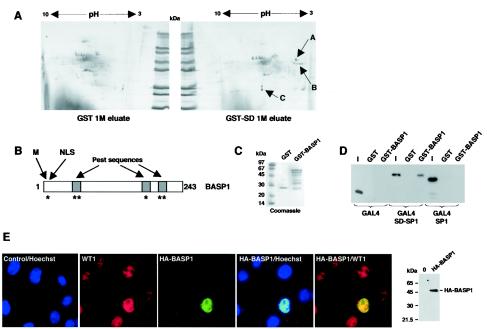
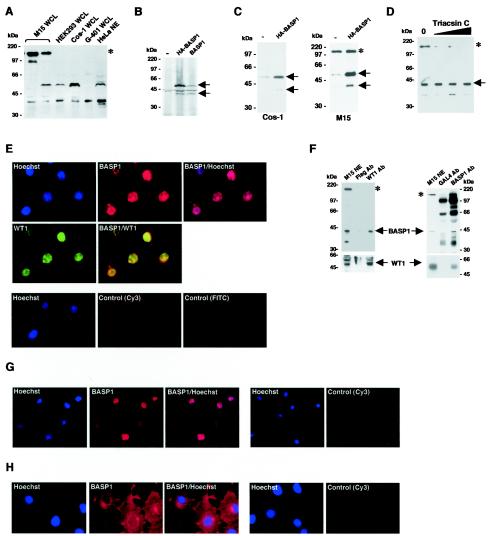
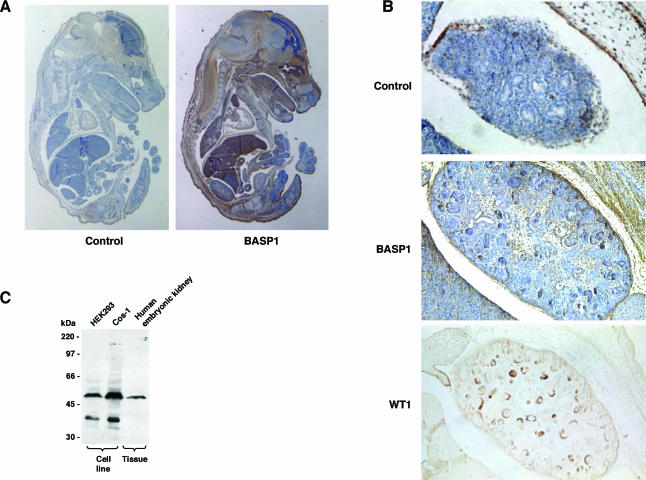
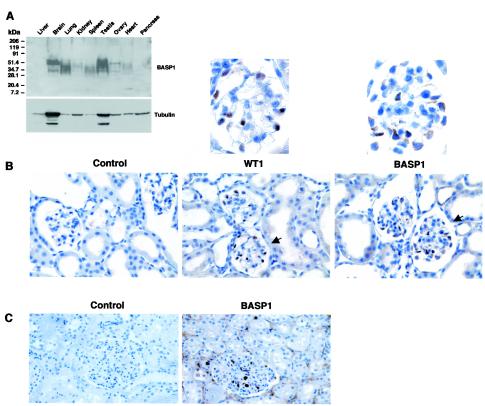
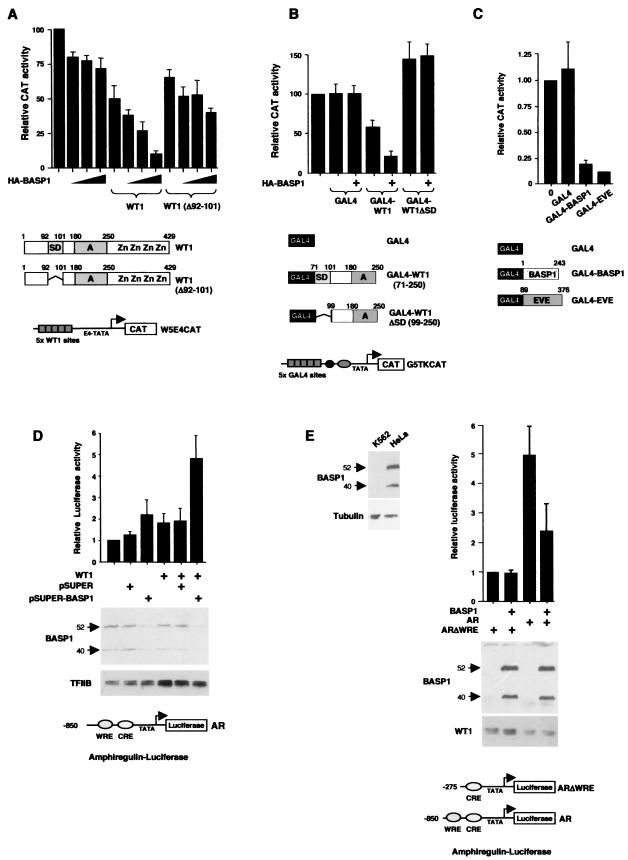
The Wilms' tumor suppressor protein WT1 is a transcriptional regulator that plays a key role in the development of the kidneys. The transcriptional activation domain of WT1 is subject to regulation by a suppression region within the N terminus of WT1. Using a functional assay, we provide direct evidence that this requires a transcriptional cosuppressor, which we identify as brain acid soluble protein 1 (BASP1). WT1 and BASP1 associate within the nuclei of cells that naturally express both proteins. BASP1 can confer WT1 cosuppressor activity in transfection assays, and elimination of endogenous BASP1 expression augments transcriptional activation by WT1. BASP1 is present in the developing nephron structures of the embryonic kidney and, coincident with that of WT1, its expression is restricted to the highly specialized podocyte cells of the adult kidney. Taken together, our results show that BASP1 is a WT1-associated factor that can regulate WT1 transcriptional activity.


Figures

FIG. 1.
FIG. 1.
Dissection of the WT1 transcriptional suppression domain. (A) Schematic of WT1, indicating the transcriptional suppression domain (SD) (amino acids 71 to 101) and the transcriptional activation domain (A). The vertical lines indicate the regions of alternative splicing, with the 17-amino-acid insertion located centrally and the KTS insertion located between the third and fourth zinc fingers (Zn). (B) The indicated GAL4 fusion proteins were prepared, and 1 μg was analyzed by SDS-PAGE and Coomassie blue staining. Molecular mass markers are shown at the left. (C) The GAL4 fusion proteins (100 ng) were tested in an in vitro transcription assay with a HeLa cell nuclear extract and the reporter G5E4T (shown at the bottom). Transcripts were detected by primer extension. (D) The WT1 suppression domain was subjected to deletion and fused in frame to GAL4 and the SP1 activation domain. The amino acid sequences of the intact WT1 suppression domain and derivatives are shown. GAL4-SD-SP1 derivatives were expressed in E. coli, purified, and examined by SDS-PAGE and Coomassie blue staining (1 μg of each protein). Transcription assays were as described for panel C. (E) Expression constructs (1 μg) that produce GAL4(1-93), GAL4-SD (residues 71 to 101)-A (WT1 activation domain residues 180 to 250), GAL4-SD (residues 92 to 101)-A, and GAL4-A were transfected into 293 cells. The reporter is the same as that used in panel C but linked to the CAT gene. The results are presented as mean relative CAT activity in three experiments with standard deviation.
FIG. 2.
FIG. 2.
Evidence for a WT1 transcriptional cosuppressor. (A) One microgram of a synthetic peptide (SD, EQCLSAFTLHFSGQFTGT; residues 86 to 103 of WT1) or a control peptide (MAAPLLHTRLPGDAC; derived from hRRN3 [25]) was incubated for 30 min on ice with 250 μg of HeLa nuclear extract. Transcription assays were as described for Fig. 1. (B) Antibodies raised against the WT1 suppression domain peptide or a control antibody were incubated with the recombinant GAL4 fusion proteins (100 ng) for 30 min on ice prior to assembly of the transcription assay. (C) GST or a GST fusion of the WT1 suppression domain (residues 71 to 101; GST-SD) were purified from E. coli and examined by SDS-PAGE (5 μg of each protein). Molecular mass markers are shown at the left. (D) HeLa nuclear extract (10 mg) was fractionated over a column containing 5 mg of either GST or GST-SD linked to 1 ml of glutathione agarose. The flowthrough (FT) was used in transcription assays with the GAL4 fusion proteins as described for panel A. (E) HeLa nuclear extract that had been fractionated over a GST-SD column was used alone or supplemented with dialyzed eluates from the GST-SD column or a GST column. The extracts were then tested in an in vitro transcription assay as described for panel D.
FIG. 3.
FIG. 3.
BASP1 associates with the WT1 transcriptional suppression domain and localizes with WT1 in the nuclei of M15 cells. (A) Proteins in the 1 M eluates from the GST and GST-SD columns were resolved by two-dimensional electrophoresis and examined by silver staining. Spots (A to C) that were unique to the GST-SD eluate are indicated. (B) Schematic of BASP1. M, myristoylation signal sequence; NLS, nuclear localization sequence. Regions of PEST sequences are shown by shading. Potential protein kinase C and casein kinase II phosphorylation sites are indicated by asterisks. (C) GST and GST-BASP1 were purified from E. coli and assessed by SDS-PAGE and Coomassie blue staining. Molecular mass markers are shown at left. (D) GST pull-down assay showing that GAL4-SD-SP1 interacts with GST-BASP1 but not with GST. GAL4-SP1 does not interact with GST-BASP1, suggesting that the interaction with GAL4-SD-SP1 is mediated via the suppression domain. Lanes I, 10% of the input into each assay. Detection of the GAL4 derivatives was by immunoblotting with anti-GAL4 antibodies. (E) A plasmid encoding HA-tagged BASP1 under the control of a CMV promoter was transfected into mouse M15 cells. Cells were fixed and probed with anti-WT1 antibody (and then secondary Cy3 antibody [red]) and anti-HA tag antibody (and then secondary FITC antibody [green]). The nuclei were counterstained with Hoechst stain (blue).
FIG. 4.
FIG. 4.
Characterization of BASP1. (A) A panel of cell lines was analyzed by Western blotting with anti-BASP1 antibodies. Molecular mass markers are shown at the left. WCL, whole cell lysate; NE, nuclear extract. Immunoreactive bands common among the cell lines are indicated by arrows (52 and 40 kDa). The BASP1 form present only in M15 cells is indicated by an asterisk. (B) pcDNA3 (−), pcDNA3-HA-BASP1, or pcDNA3-BASP1 was added to rabbit reticulocyte lysate and [35S]methionine. The translated products were resolved by SDS-PAGE and visualized by autoradiography. The two products corresponding to BASP1 are indicated by arrows. (C) Cos-1 or M15 cells were transfected with either empty CMV expression vector (−) or CMV expression vector driving the production of HA-tagged BASP1 (3 μg each). Cells were harvested, and extracts were immunoblotted with affinity-purified anti-BASP1 antibodies. The two major forms of BASP1 (52 and 40 kDa) are indicated by arrows, and the slower-migrating form in M15 cells is indicated by an asterisk. (D) M15 cells were treated with Triacsin C (1.5, 3, and 6 μM) for 16 h, and whole-cell lysates immunoblotted with anti-BASP1 antibodies. 0, control cells. BASP1 is indicated by an arrow, and the slower-migrating form is indicated by an asterisk. (E) M15 cells were subjected to immunofluorescence with anti-WT1 and anti-BASP1 antibodies. WT1 is indicated by green, and BASP1 is indicated by red. Nuclei were counterstained with Hoechst stain. Control immunofluorescence (Cy3 and FITC) omitted the primary antibody. (F) Left panel, M15 nuclear extracts were subjected to immunoprecipitation with either anti-WT1 monoclonal antibodies or control anti-Flag monoclonal antibodies linked to agarose beads. The precipitates were resolved by SDS-PAGE and immunoblotted withpolyclonal anti-BASP1 antibodies (top panel) or anti-WT1 polyclonal antibodies (bottom panel). BASP1 products are indicated by an asterisk and arrow. WT1 forms are indicated by an arrow. M15, 4% of the input into the immunoprecipitation assay. Right panel, M15 nuclear extracts were subjected to immunoprecipitation with either purified anti-BASP1 polyclonal antibodies or a control anti-GAL4 purified polyclonal antibody linked to protein A-agarose beads. The precipitates were resolved by SDS-PAGE and immunoblotted with anti-BASP1 polyclonal antibodies (top panel) or anti-WT1 monoclonal antibodies (bottom panel). Specific BASP1 products are indicated by an asterisk and arrow. The nonspecific bands present in both the anti-BASP1 immunoprecipitation and the control (GAL4 immunoprecipitation) arise from the use of rabbit antibodies for both the immunoprecipitation and immunoblot. WT1 forms are indicated by an arrow. (G) G-401 cells derived from a human kidney tumor were subjected to immunofluorescence with anti-BASP1 antibodies (staining in red). The nuclei were counterstained with Hoechst stain. (H) Same as panel G, except that Cos-1 cells were used.
FIG. 5.
FIG. 5.
Expression of BASP1 in the developing mouse embryo. (A) Sections from 15.5-day-postcoitum mouse embryos were subjected to immunohistochemistry with either preimmune serum (control) or anti-BASP1 antibodies. Staining was visualized with diaminobenzidine, and counterstaining was with hematoxylin. Magnification, ×12.5. (B) Immunohistochemistry of mouse embryonic kidney sections with preimmune serum (control) or anti-BASP1 antibodies (magnification, ×100; sections are the same as those shown in panel A). An adjacent section stained with an anti-WT1 antibody, with counterstain omitted to emphasize the staining pattern, is also shown (magnification, ×100). Enlarged images of the BASP1 and WT1 staining are included to highlight specific renal vesicles. (C) The indicated cell line extracts and a whole-cell extract derived from HEK tissue were subjected to immunoblotting with affinity-purified anti-BASP1 antibodies. Molecular mass markers are shown at the left.
FIG. 6.
FIG. 6.
Expression of BASP1 in adult tissues and the adult kidney. (A) A human multitissue blot was probed with affinity-purified anti-BASP1 antibodies. Molecular mass markers are shown at the left. The blot was then stripped and reprobed with antitubulin antibodies. (B) Adult mouse kidney sections were probed with either anti-WT1 antibodies or affinity-purified anti-BASP1 antibodies. The control panel omitted the primary antibody. Detection was via diaminobenzidine. The sections were counterstained with hemalum. Magnification, ×200. The glomeruli indicated by arrows are shown at the top at a higher magnification (×600). (C) Same as panel B, except that the kidney section was from a human adult and only the affinity-purified BASP1 antibody was used.
FIG.7.
FIG.7.
BASP1 exhibits transcriptional cosuppressor activities. (A) The reporter W5E4CAT (2 μg) was transfected into 293 cells along with 2 μg of empty CMV vector or a CMV vector driving expression of either intact WT1 (−/− isoform) or a deletion mutant of WT1 (Δ92-101). The HA-BASP1 plasmid was added in increasing amounts (1, 2, and 4 μg). After 72 h, the cells were harvested and lysed and CAT activity was measured. The activity of the W5E4CAT reporter alone is set at a value of 100% activity, and other measurements are presented relative to this. The results are the means from three experiments with standard deviations. (B) The reporter G5tkCAT (1 μg) was transfected into HEK 293 cells along with a plasmid (1 μg) driving the expression of either GAL4(1-93), GAL4(1-93)-WT1 (residues 71 to 250) or GAL4(1-93)-WT1 (residues 99 to 250). Where indicated, the plasmid driving expression of HA-BASP1 was also included (2 μg). CAT assays and data presentation are as in panel A. (C). The G5tkCAT reporter (1 μg) was transfected into 293 cells as for panel A, except that 2 μg of a plasmid driving expression of either GAL4(1-93), GAL4(1-93)-BASP1, or GAL4(1-93)-EVE was also included. Data presentation is as in panel A. (D) The amphiregulin promoter-luciferase reporter (AR) (shown at bottom) was transfected into HeLa cells with CMV-WT1 where indicated. Either pSUPER or pSUPER driving BASP1 RNAi expression was also included where indicated (see Materials and Methods for full details of the transfection protocol). Relative luciferase activity is presented in arbitrary units. Bottom panel, cell lysates were immunoblotted with either anti-BASP1 antibodies or anti-TFIIB antibodies. (E) At left, K562 and HeLa whole-cell extracts were immunoblotted with anti-BASP1 (top) and antitubulin (bottom) antibodies. The 52- and 40-kDa BASP1 forms are indicated. K562 cells were transfected with an amphiregulin promoter reporter that either contains (AR) or lacks (ARΔWRE) the WT1 DNA-binding site (1 μg). Where indicated, a plasmid driving expression of BASP1 was included (1 μg). Luciferase activity was measured and presented as in panel D. The immunoblots below the graph show the expression of the transfected BASP1 and the endogenous WT1.

References

    1. Armstrong, J. F., K. Pritchard-Jones, W. A. Bickmore, N. D. Hastie, and J. B. L. Bard. 1992. The expression of the Wilms' tumour gene, WT1, in the developing mammalian embryo. Mech. Dev. 40:85-97. - PubMed
    1. Ausubel, F. M., R. Brent, R. E. Kingston, D. D. Moore, J. G. Seidman, J. A. Smith, and K. Struhl. 2002. Short protocols in molecular biology, 5th ed., vol. 1, p. 16. John Wiley and Sons, Inc., New York, N.Y.
    1. Brummelkamp, T. R., R. Bernards, and R. Agami. 2002. A system for stable expression of short interfering RNAs in mammalian cells. Science 296:550-553. - PubMed
    1. Davies, R., A. Moore, A. Schedl, E. Bratt, K. Miyagawa, M. Ladomery, C. Miles, A. Menke, V. van Heyningen, and N. Hastie. 1999. Multiple roles for the Wilms' tumor suppressor, WT1. Cancer Res. 59:1747S-1750S. - PubMed
    1. Drummond, I. A., S. L. Madden, P. Rohwernutter, G. I. Bell, V. P. Sukhatme, and F. J. Rauscher. 1992. Repression of the insulin-like growth factor-II gene by the Wilms-tumor suppressor WT1. Science 257:674-678. - PubMed

Publication types

MeSH terms