. 2004 Jan;24(2):595-607.
doi: 10.1128/MCB.24.2.595-607.2004.

Nuclear reorganization of mammalian DNA synthesis prior to cell cycle exit

Affiliations

Nuclear reorganization of mammalian DNA synthesis prior to cell cycle exit

David A Barbie et al. Mol Cell Biol. 2004 Jan.

Abstract

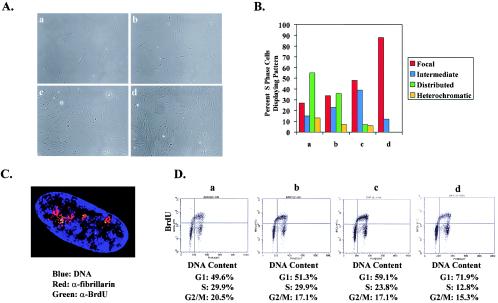
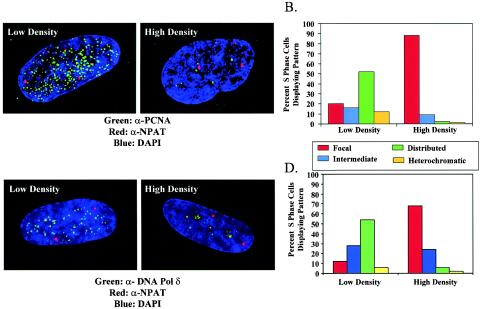
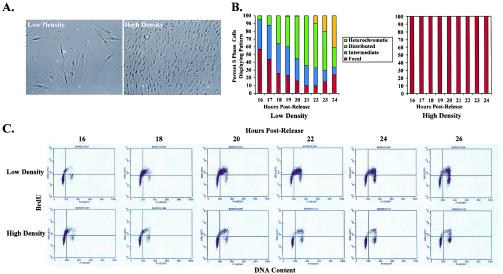
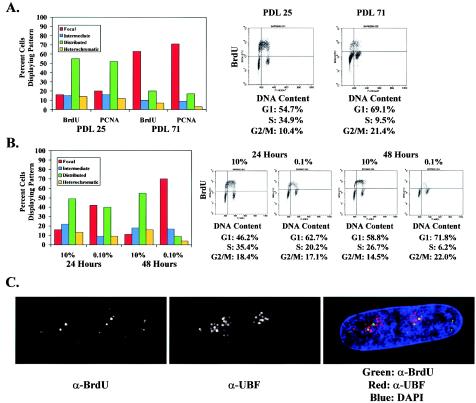
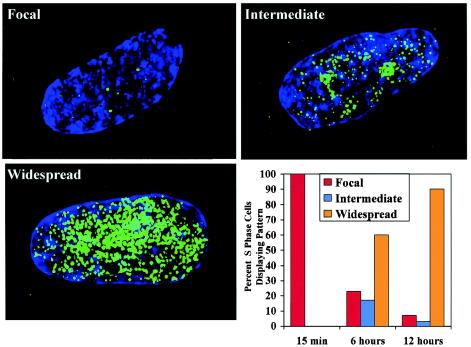
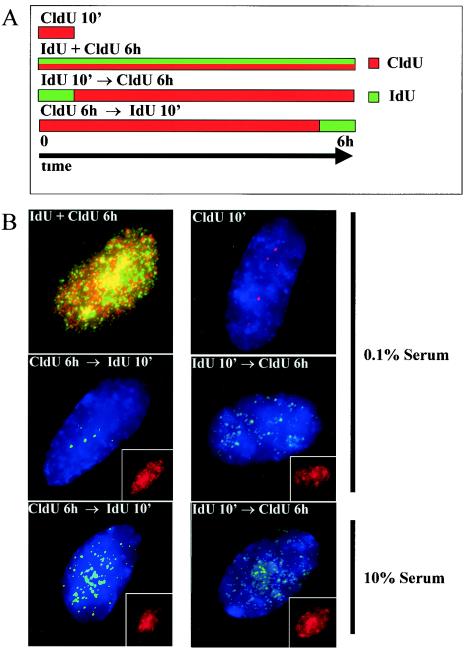
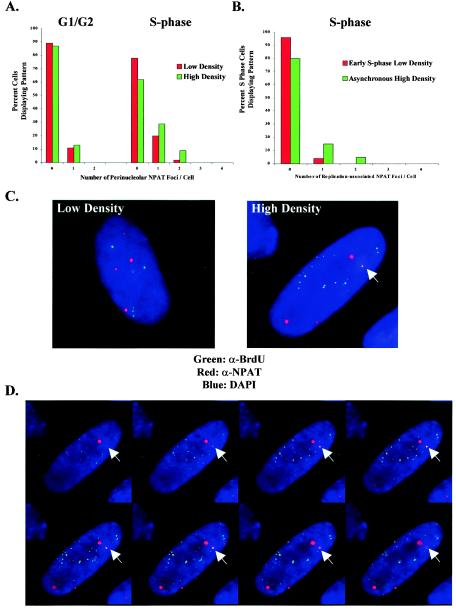
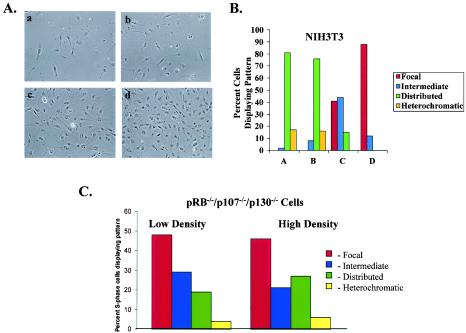
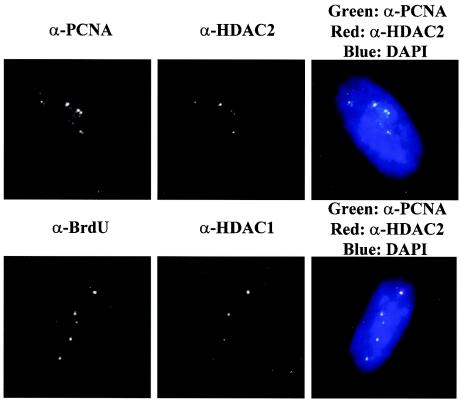
In primary mammalian cells, DNA replication initiates in a small number of perinucleolar, lamin A/C-associated foci. During S-phase progression in proliferating cells, replication foci distribute to hundreds of sites throughout the nucleus. In contrast, we find that the limited perinucleolar replication sites persist throughout S phase as cells prepare to exit the cell cycle in response to contact inhibition, serum starvation, or replicative senescence. Proteins known to be involved in DNA synthesis, such as PCNA and DNA polymerase delta, are concentrated in perinucleolar foci throughout S phase under these conditions. Moreover, chromosomal loci are redirected toward the nucleolus and overlap with the perinucleolar replication foci in cells poised to undergo cell cycle exit. These same loci remain in the periphery of the nucleus during replication under highly proliferative conditions. These results suggest that mammalian cells undergo a large-scale reorganization of chromatin during the rounds of DNA replication that precede cell cycle exit.


Figures

FIG. 1.
FIG. 1.
DNA replication is limited to perinucleolar foci throughout S phase as cells approach contact inhibition. (A) Distribution of replication patterns in asynchronous WI-38 cells plated at different cell densities. Panels a to d show phase-contrast images of cells from which the data were collected. (B) Replication patterns of cells grown at different densities. Lowercase letters correspond to the phase-contrast images in panel A. The data shown are characteristic of those from multiple experiments. Representative images of focal, intermediate, distributed, and heterochromatic patterns have been reported previously (17). (C) A representative cell undergoing DNA replication at high cell density. The image was acquired by deconvolution microscopy and represents a compressed two-dimensional (volume) view of the entire nucleus. The nucleolus is marked with antibodies to fibrillarin (α-fibrillarin). Note that green BrdU foci appear in regions near the nucleolus. Some BrdU foci appear yellow but in fact were above or below the nucleolus when examined in individual images that were used to compose the volume view depicted. (D) Cell cycle distributions of cells analyzed above, ranging from the lowest cell density on the left to the highest cell density on the right. Two-dimensional FACS analysis was used to plot BrdU incorporation versus DNA content and thus to assess the position of BrdU-labeled cells in S phase.
FIG. 2.
FIG. 2.
PCNA and DNA pol δ localization in asynchronous WI-38 cells plated at low or high cell density. (A and B) PCNA localization in S-phase cells propagated at low or high density was determined. S-phase cells were identified because they displayed four nuclear spots upon staining with antibodies directed against NPAT (α-NPAT). DAPI, 4′,6′-diamidino-2-phenylindole. (C and D) DNA pol δ localization was determined in an identical manner under similar growth conditions. All images were acquired by deconvolution microscopy and represent a compressed two-dimensional view of the entire nucleus.
FIG. 3.
FIG. 3.
Nuclear reorganization of DNA replication at high cell density is not associated with a change in S-phase kinetics. (A) Phase-contrast images of the low- and high-density cells used. (B) Replication patterns observed in WI-38 cells at hourly time points after synchronous release from contact inhibition into low versus high cell density. (C) FACS analysis demonstrating progression of these cells through S phase at low and high cell densities. Cells begin to enter S phase at 16 h after release in both cases. Approximately 60% of cells have progressed through S phase into G2/M by 26 h at low density, compared to only 10% of cells at high density; however, the rates of movement through S phase are similar in both instances.
FIG. 4.
FIG. 4.
The shift towards perinucleolar replication foci is more generally associated with cell cycle exit. (A) Comparison of replication patterns in low-density asynchronous WI-38 cells at PDL 25 and in cells undergoing senescence at PDL 71. Replication patterns are shown by both BrdU incorporation and PCNA localization in cells containing four NPAT foci. FACS analysis demonstrates that fewer cells are in S phase as cells enter senescence but that these cells are evenly spread throughout S phase. (B) Analysis of replication patterns in asynchronous WI-38 cells shifted from 10% serum into 0.1% serum for 24 or 48 h. Replication patterns of serum-starved cells are compared to those of control plates incubated in 10% serum for similar lengths of time. FACS analysis reveals that serum-starved cells exit the cell cycle by 48 h. (C) Representative cell undergoing DNA replication in low-serum medium. The image was acquired by deconvolution microscopy. The nucleolus is marked with antibodies to UBF (α-UBF), a nucleolar transcription factor. Green BrdU foci appear largely in regions around the nucleolus. DAPI, 4′,6′-diamidino-2-phenylindole.
FIG. 5.
FIG. 5.
Prolonged BrdU labeling of high-density cells results in a widespread nuclear signal. S-phase cells were labeled for 15 min, 6 h, or 12 h with BrdU, followed by indirect immunofluorescence to detect replicated DNA. Images characterized as focal, intermediate, or widespread are shown. The fraction of S-phase cells with focal, intermediate, or widespread BrdU incorporation was determined for each period of labeling. The data shown are characteristic of those from multiple experiments.
FIG. 6.
FIG. 6.
Double labeling of serum-starved cells indicates that focal replication patterns persist late into S phase. (A) Schematic representation of double-labeling experiments. (B) Pulse-labeling experiments were performed with IMR-90 fibroblasts kept for 48 h in 10 or 0.1% FBS. CldU-labeled DNA is shown in red, and IdU-labeled DNA is shown in green. The top four panels are representative images of serum-starved cells, and the bottom two panels are representative images of cells maintained with high serum concentrations. The insets in the bottom four panels show CldU signal from the same cell. Longer exposure times were necessary to detect IdU signal in pulse-chase experiments. Images were collected by use of a CCD camera without deconvolution and are presented as a compressed two-dimensional view of the entire nucleus.
FIG. 7.
FIG. 7.
Redistribution of histone gene loci to perinucleolar replication foci during S phase in high-density cells. (A) Localization of histone gene loci relative to the nucleolus in asynchronous low- and high-density WI-38 cells. An antibody to NPAT (α-NPAT) is used to mark the histone gene clusters. At high cell density there is a significant redistribution of NPAT foci to perinucleolar regions in S-phase cells. NPAT foci associated with chromosome 6 are more intense than those associated with chromosome 1, and therefore they are distinguishable. (B) Comparison of histone gene loci to perinucleolar replication foci in early-S-phase low-density cells and asynchronous high-density cells. Whereas overlap between NPAT and the perinucleolar foci is minimal at low cell density, there is a significant increase in overlap at high cell density, with up to two NPAT foci coinciding with perinucleolar sites of replication. (C) Representative volume view images displaying the relative lack of colocalization between NPAT and perinucleolar replication foci at low cell density (left) and an increase in overlap at high cell density (right). Colocalization of NPAT (red) and BrdU (green) appears yellow. DAPI, 4′,6′-diamidino-2-phenylindole. (D) Slices of 0.25 μm through the nucleus of the high-density cell shown in panel C, demonstrating that the overlap between NPAT and BrdU occurs in the same plane and is not a result of volume averaging.
FIG. 8.
FIG. 8.
Immortalized cells shift to perinucleolar replication prior to cell cycle exit if they arrest in response to contact inhibition. (A) Panels a to d are phase-contrast images of cells in which replication patterns were determined by indirect immunofluorescence. (B) Distribution of replication patterns in asynchronous NIH 3T3 cells plated at different cell densities. The data shown are characteristic of those from multiple experiments. (C) Replication patterns observed in pRB−/−/p107−/−/p130−/− cells plated at low and high cell densities.
FIG. 9.
FIG. 9.
HDAC1 and HDAC2 colocalize with perinucleolar replication foci in asynchronous high-density cells. A comparison of BrdU and PCNA localization with that of HDAC1 and HDAC2, respectively, in asynchronous high-density WI-38 cells pulse-labeled with BrdU for 15 min is shown. The merged images appear on the right, with only CCD imaging and no deconvolution. The nucleus is stained by DAPI (4′,6′-diamidino-2-phenylindole). Colocalization between BrdU (green) and HDAC1 (red) and between PCNA (green) and HDAC2 (red) appears yellow. α-, anti-.

References

    1. Almouzni, G., and A. P. Wolffe. 1993. Replication-coupled chromatin assembly is required for the repression of basal transcription in vivo. Genes Dev. 7:2033-2047. - PubMed
    1. Bannister, A. J., P. Zegerman, J. F. Partridge, E. A. Miska, J. O. Thomas, R. C. Allshire, and T. Kouzarides. 2001. Selective recognition of methylated lysine 9 on histone H3 by the HP1 chromo domain. Nature 410:120-124. - PubMed
    1. Berezney, R., D. D. Dubey, and J. A. Huberman. 2000. Heterogeneity of eukaryotic replicons, replicon clusters, and replication foci. Chromosoma 108:471-484. - PubMed
    1. Chuang, L. S.-H., H. I. Ian, T. W. Koh, H. H. Ng, G. Xu, and B. F. Li. 1997. Human DNA-(cytosine-5) methyltransferase-PCNA complex as a target for p21WAF1. Science 277:1996-2000. - PubMed
    1. Dimitrova, D. S., and R. Berezney. 2002. The spatio-temporal organization of DNA replication sites is identical in primary, immortalized, and transformed mammalian cells. J. Cell Sci. 115:4037-4051. - PubMed

Publication types