. 2004 Jan;24(2):741-56.
doi: 10.1128/MCB.24.2.741-756.2004.

Molecular signatures of self-renewal, differentiation, and lineage choice in multipotential hemopoietic progenitor cells in vitro

Affiliations

Molecular signatures of self-renewal, differentiation, and lineage choice in multipotential hemopoietic progenitor cells in vitro

Ludovica Bruno et al. Mol Cell Biol. 2004 Jan.

Abstract

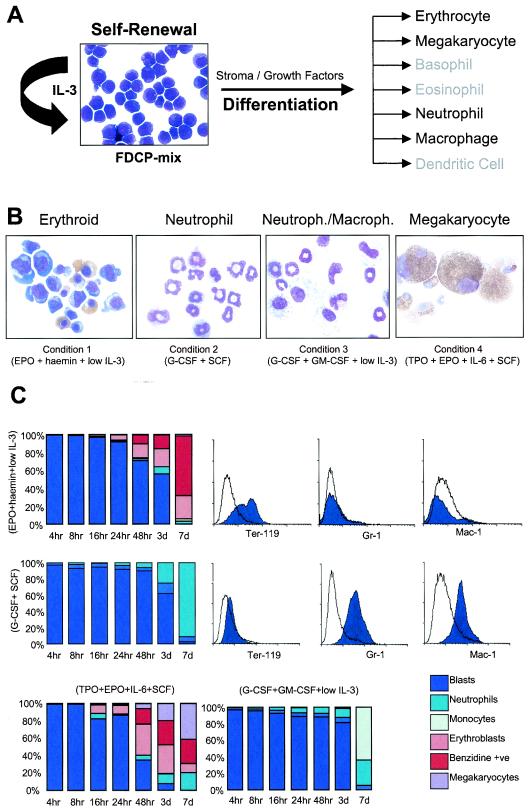
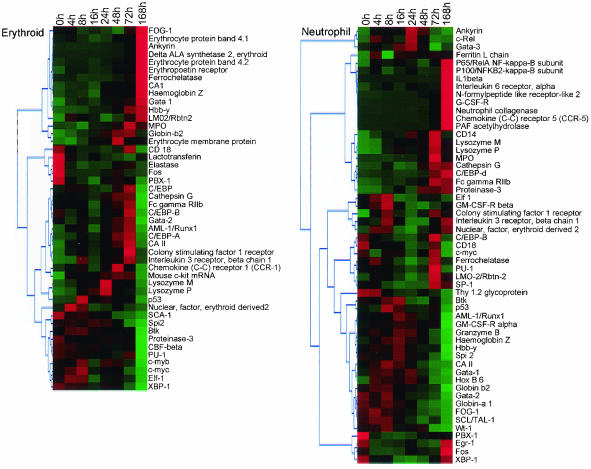
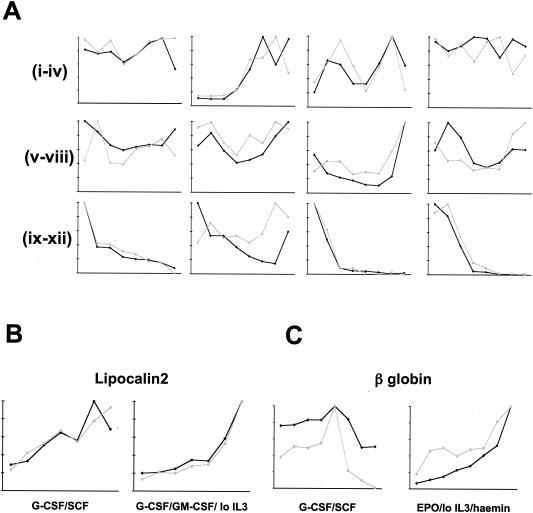
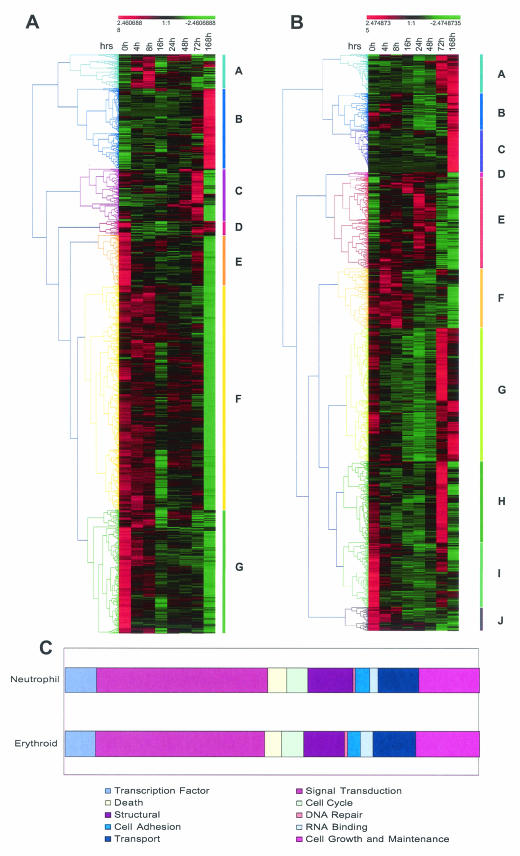
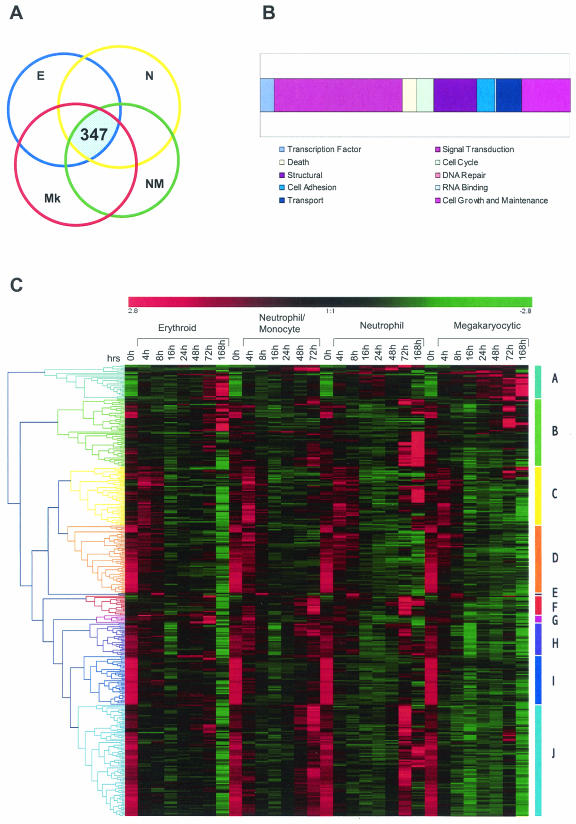
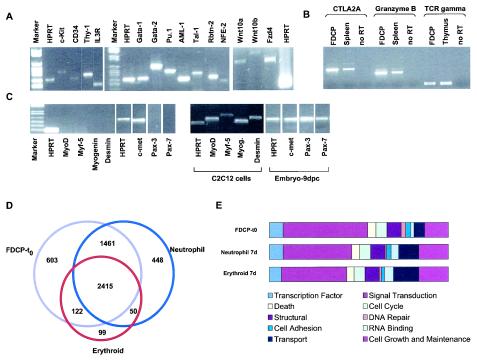
The molecular mechanisms governing self-renewal, differentiation, and lineage specification remain unknown. Transcriptional profiling is likely to provide insight into these processes but, as yet, has been confined to "static" molecular profiles of stem and progenitors cells. We now provide a comprehensive, statistically robust, and "dynamic" analysis of multipotent hemopoietic progenitor cells undergoing self-renewal in response to interleukin-3 (IL-3) and multilineage differentiation in response to lineage-affiliated cytokines. Cells undergoing IL-3-dependent proliferative self-renewal displayed striking complexity, including expression of genes associated with different lineage programs, suggesting a highly responsive compartment poised to rapidly execute intrinsically or extrinsically initiated cell fate decisions. A remarkable general feature of early differentiation was a resolution of complexity through the downregulation of gene expression. Although effector genes characteristic of mature cells were upregulated late, coincident with morphological changes, lineage-specific changes in gene expression were observed prior to this, identifying genes which may provide early harbingers of unilineage commitment. Of particular interest were genes that displayed differential behavior irrespective of the lineage elaborated, many of which were rapidly downregulated within 4 to 8 h after exposure to a differentiation cue. These are likely to include genes important in self-renewal, the maintenance of multipotentiality, or the negative regulation of differentiation per se.


Figures

FIG. 1.
FIG. 1.
Experimental system. (A) Photomicrograph of self-renewing FDCP-mix cells and a scheme indicating their differentiation potentials in vitro. (B) Typical morphologies of cells produced under the cytokine conditions indicated. Day 7 cells were harvested, cytospun, and stained with May-Grünwald-Giemsa and o-dianisidine. Staining for acetyl cholinesterase was used to identify megakaryocytic cells. (C) After being stained the cells were morphologically assessed. The percentages of different cell types at various time points during differentiation are shown on the bar charts. The accompanying histograms present the results of fluorescence-activated cell sorting analyses of cell surface marker expression at T0 (unfilled) and day 7 (filled) during erythroid and neutrophilic differentiation, obtained with the antibodies indicated, as well as isotype controls (not shown).
FIG. 2.
FIG. 2.
Validation of microarray results through analysis of the behavior of well characterized hemopoiesis-affiliated marker genes. Genes were selected for analysis based on (i) having a known profile of expression in hemopoietic cells, (ii) representation on the genechip, and (iii) exhibiting differential expression during differentiation of FDCP-mix. A diagrammatic interpretation of gene expression at different time points of erythroid (upper panel) and neutrophil (lower panel) differentiation is shown; green and red represent underexpression and overexpression, respectively, relative to the median, and genes exhibiting similar temporal behavior are clustered together. Details of the procedures by which differentially expressed genes were identified and subsequently clustered are explained in Materials and Methods and in the legend to Fig. 4.
FIG. 3.
FIG. 3.
Comparison of gene expression assayed by microarray and by RQ-PCR. For each series and for each gene analyzed, the values of both parameters at each time point were normalized relative to that with the highest value, which was arbitrarily assigned as 10. Microarray signal intensity is plotted in black, and RQ-PCR fluorescence in gray. (A) Analysis of arbitrarily selected genes during neutrophil differentiation of FDCP-mix cells supported by G-CSF plus SCF. Subpanels (from left to right): i, CD14; ii, MPO; iii, c-kit; vi, IL-3 receptor α chain; v, HPRT; vi, GAPDH; vii, schlafen 2; viii, β-catenin; ix, NDPP1; x, selenium-binding protein; xi, nephroblastoma overexpressed; xii, AEG-1 (acidic epididymal glycoprotein 1). (B) Analysis of lipocalin 2 (neutrophil marker) during neutrophil differentiation of FDCP-mix cells supported by G-CSF plus SCF (i) and during myelomonocytic differentiation of FDCP-mix cells supported by G-CSF plus GM-CSF plus low IL-3 (ii). (C) Analysis of β globin (erythroid marker) during neutrophil differentiation of FDCP-mix cells supported by G-CSF plus SCF (i) and during erythroid differentiation of FDCP-mix cells supported by EPO plus low IL-3 plus hemin (ii) as indicated.
FIG. 4.
FIG. 4.
Analysis of differentially expressed genes in erythroid (A) and neutrophil (B) differentiation. The adjusted expression levels (mean = 0; variance = 1) at the indicated time points were hierarchically clustered by using uncentered Pearson correlation and average linkage clustering. The range of relative expression levels from lowest to highest is represented by the green and red shading, respectively. Colored bars along each graph highlight prominent gene clusters (A to G for erythrocytes and A to J for neutrophils) corresponding to the color-matched branches of the tree (45). (C) Bar charts showing the distribution of all differentially expressed genes according to function. Genes were annotated by using the Simplified Ontology tool in GeneSpring. It should be noted that this analysis is partially limited by the fact that annotations are available for only a subset of genes (>70%) represented on the genechip. Also, the criteria used to assign functional categories may result in nonredundant classification of genes (i.e., one gene may be assigned twice in different categories).
FIG.5.
FIG.5.
Analysis of genes that are differentially expressed under all differentiation conditions. Gene expression levels for the four differentiation pathways analyzed (E, erythroid; N, neutrophil; NM, neutrophil/monocyte; Mk, megakaryocyte) were separately filtered by SAM as shown in Table 1. (A) The intersection of these four lists identifies 347 genes that are differentially expressed under all of the conditions tested. (B) Simplified ontologies were generated as in Fig. 4. (C) Hierarchical clustering of the 347 genes was performed as indicated in the legend for Fig. 4. Note that although all genes are differentially expressed in all four pathways they do not necessarily show similar expression profiles. For example, most of the genes in cluster D are similarly downregulated during differentiation in all pathways. However, genes belonging to cluster J show initial downregulation for all pathways and are upregulated only in neutrophil/monocyte and neutrophilic pathways at later time points.
FIG. 6.
FIG. 6.
Gene expression in self-renewing FDCP-mix cells. The detection calls algorithm of MAS 5.0 was used to identify expressed, i.e., “present,” genes. Only genes that were designated as present in three of three replicates were considered for further analysis. (A) Some of the genes reproducibly called “present” and considered to be hallmarks of stem cells and/or of hemopoietic differentiation programs were verified by RT-PCR; confirmation of expression of Wnt signaling components is also shown. (B) Analysis of lymphoid priming in FDCP-mix cells. Spleen and thymus samples provide positive controls, and reactions performed on FDCP-mix cells in the absence of RT are indicated. (C) Analysis of muscle-affiliated gene expression programs in FDCP-mix cells. Muscle cell line (C2C12) and day 9 developing embryo samples served as positive controls. (D) Overlap in gene expression profiles of self-renewing (FDCP-t0) and erythroid or neutrophil differentiated FDCP-mix cells (day 7), identifies 603, 99, and 448 genes as uniquely expressed in the self-renewing, erythroid, and neutrophilic compartments, respectively. Functional annotation of these genes is shown in panel E. Simplified ontologies were generated as described for Fig. 4.
FIG. A1.
FIG. A1.
M-versus-A plots of all samples used in the present study.
FIG. A2.
FIG. A2.
Clustering of sample replicates. Abbreviations: E, erythroid; N, neutrophil; NM, neutrophil/monocyte; Mk, megakaryocyte.

References

    1. Akashi, K., X. He, J. Chen, H. Iwasaki, C. Niu, B. Steenhard, J. Zhang, J. Haug, and L. Li. 2003. Transcriptional accessibility for genes of multiple tissues and hematopoietic lineages is hierarchically controlled during early hematopoiesis. Blood 101:383-389. - PubMed
    1. Benjamini, Y., and Y. Hochberg. 1995. Controlling the false discovery rate: a practical and powerful approach to multiple testing. J. R. Stat. Soc. B 57:289-300.
    1. Bradshaw, A. D., and E. H. Sage. 2001. SPARC, a matricellular protein that functions in cellular differentiation and tissue response to injury. J. Clin. Investig. 107:1049-1054. - PMC - PubMed
    1. Chen, C. Z., M. Li, D. de Graaf, S. Monti, B. Gottgens, M. J. Sanchez, E. S. Lander, T. R. Golub, A. R. Green, and H. F. Lodish. 2002. Identification of endoglin as a functional marker that defines long-term repopulating hematopoietic stem cells. Proc. Natl. Acad. Sci. USA 99:15468-15473. - PMC - PubMed
    1. Delassus, S., I. Titley, and T. Enver. 1999. Functional and molecular analysis of hematopoietic progenitors derived from the aorta-gonad-mesonephros region of the mouse embryo. Blood 5:1495-1503. - PubMed

MeSH terms

Substances