. 2003 Dec 15;17(24):3075-86.
doi: 10.1101/gad.1155703.

Tap and NXT promote translation of unspliced mRNA

Affiliations

Tap and NXT promote translation of unspliced mRNA

Li Jin et al. Genes Dev. .

Abstract

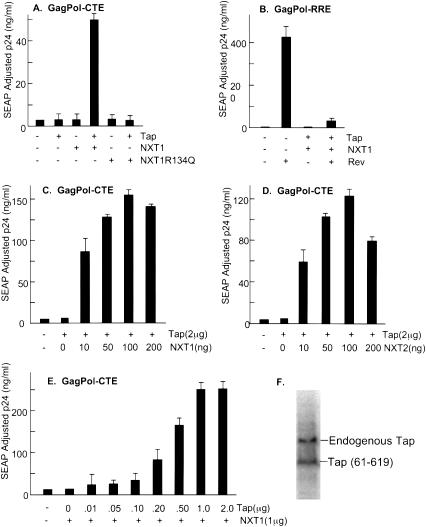
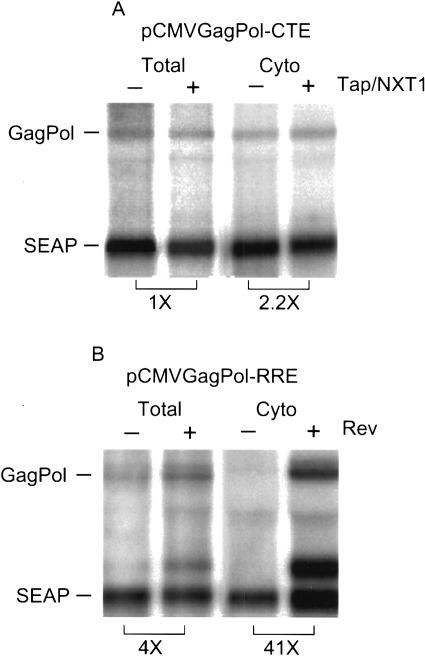
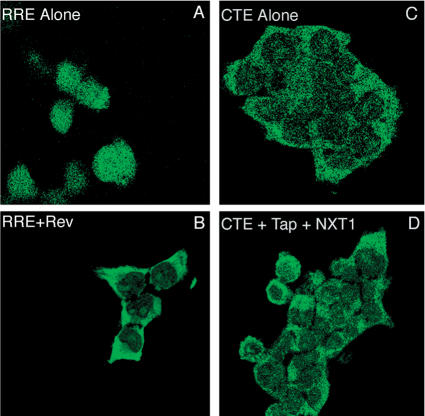
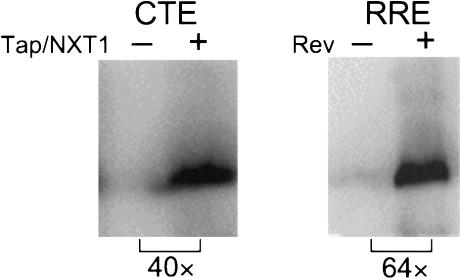
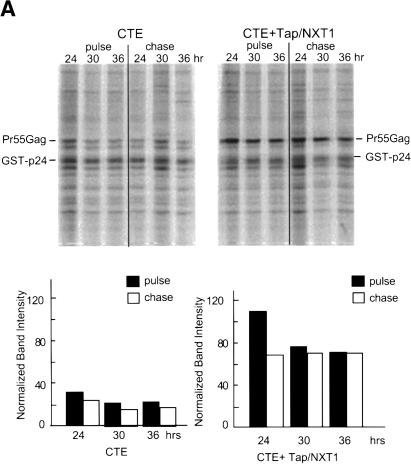
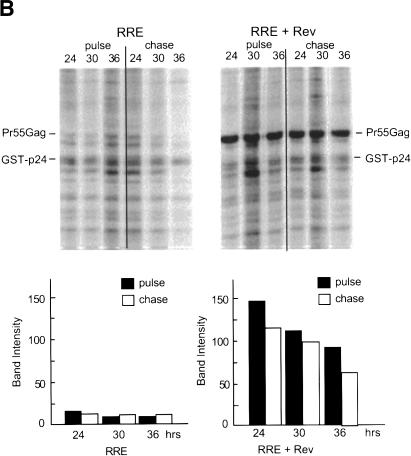
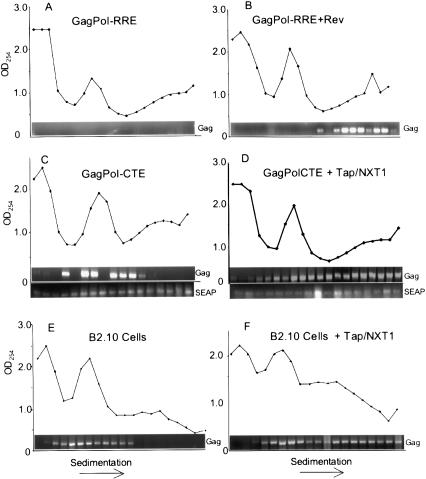
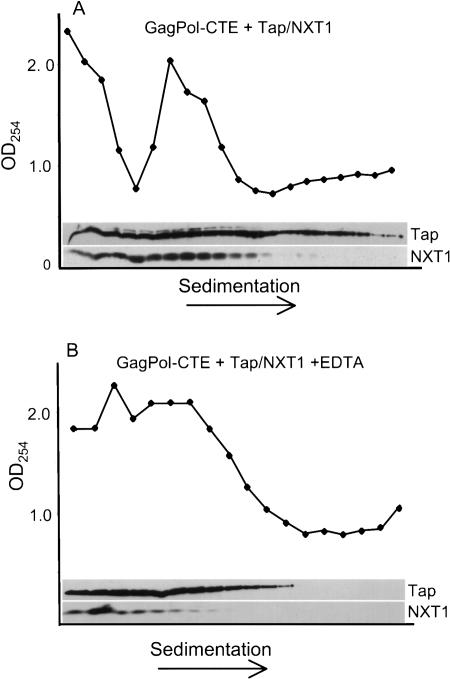
Tap has been proposed to play a role in general mRNA export and also functions in expression of RNA with retained introns that contain the MPMV CTE (constitutive transport element). Tap forms a functional heterodimer with NXT/p15. We have previously demonstrated that unspliced intron-containing CTE RNA is efficiently exported to the cytoplasm in mammalian cells. Here we show that Tap and NXT proteins function together to enhance translation of proteins from the exported CTE RNA. Pulse chase experiments show that Tap/NXT significantly increases the rate of protein synthesis. Sucrose gradient analysis demonstrates that Tap and NXT efficiently shift the unspliced RNA into polyribosomal fractions. Furthermore, Tap, but not NXT is detected in polyribosomes. Taken together, our results indicate that Tap and NXT serve a role in translational regulation of RNA after export to the cytoplasm. They further suggest that Tap/NXT may play a role in remodeling of cytoplasmic RNP complexes, providing a link between export pathways and cytoplasmic fate.


Figures

Figure 1.
Figure 1.
Effects of Tap and NXT1 on p24 expression from a GagPolCTE reporter construct in 293T cells. (A) Exogenously added Tap and NXT1 dramatically enhance p24 expression. 293T cells (3 × 10⁶) were transfected with 5 μg of pCMVGagPolCTE and 0.25 μg of pCMVSEAP with or without 2 μg of pCMVTap and 1 μg of pcDNANXT1 or pcDNANXT1R134Q. At 72 h posttransfection, supernatants were collected and analyzed for p24 levels and SEAP activity. The p24 values shown have been normalized for SEAP activity. (B) Rev function is inhibited by expression of exogenous Tap and NXT1. 293T cells (3 × 10⁶) were transfected with 5 μg of pCMVGagPolRRE and 0.25 μg of pCMVSEAP with or without 2 μg of pCMVTap and 1 μg of pcDNANXT1 in the absence or presence of 1 μg of pCMVRev. Supernatants were harvested and analyzed as described in Figure 1A. (C) The effect of increasing amounts of NXT1 on p24 expression from a GagPolCTE reporter in 293T cells. Transfections and analysis are as described in the legend of Figure 1A except that the amount of pcDNANXT1 was varied. (D) The effect of increasing amounts of NXT2 on p24 expression from a GagPolCTE reporter in 293T cells. Transfections and analysis are as described in the legend of Figure 1A except that the amount of pcDNANXT2 was varied. (E) The effect of increasing amounts of Tap on p24 expression from a GagPolCTE reporter in 293T cells. Transfections and analysis are as described in the legend of Figure 1A. (F) Analysis of Tap proteins in transfected 293T cells. Cells (3 × 10⁶) were transfected with 5 μg of GagPolCTE reporter constructs together with 1 μg each of pCMVTap and pcDNANXT1 plasmids, harvested at 65 h posttransfection and analyzed by Western blot. The Western blot was performed on whole-cell lysates using an anti-Tap polyclonal antibody, and 125I-coupled protein A for detection. Exogenous and endogenous Tap proteins are indicated. Tap expressed from the transfected plasmid lacks 60 amino acids at the N-terminal end, compared with the endogenously expressed Tap protein.
Figure 2.
Figure 2.
Tap and NXT1 do not specifically increase the levels of cytoplasmic CTE RNA in 293T cells. (A) 293T cells (1 × 10⁷) were transfected with 20 μg of the pCMVGagPolCTE reporter plasmid and 5 μg of pCMVSEAP in the presence or absence of 6 μg of pCMVTap, and 3 μg of pcDNANXT1. (B) 293T cells (1 × 10⁷) were transfected with 20 μg of pCMVGagPolRRE and 5 μg of pCMVSEAP in the presence or absence of 5 μg of pCMVRev. Northern blot analyses were performed on cytoplasmic and total poly(A)+ RNA isolated from the 293T cells 65 h after transfection. GagPol- and SEAP-specific mRNAs were detected using specific radiolabeled DNA probes. The blots were analyzed using a Molecular Dynamics PhosphorImager and ImageQuant software. Brackets show the fold difference between the indicated lanes in the levels of the GagPol RNA bands after adjustment for variations in SEAP RNA levels.
Figure 3.
Figure 3.
In situ RNA hybridization of RNA produced from pCMVGagPolCTE and pCMVGagPolRRE. (A,B) Rev coexpression causes relocalization of GagPolRRE RNA to the cytoplasm. (C,D) Tap and NXT1 coexpression does not visibly change the cytoplasmic localization of GagPolCTE RNA. 293T cells were transfected with the indicated constructs as described in Figure 1A,B. At 48 h after transfection, cells were fixed and hybridized to an anti-sense digoxigenin (DIG)-labeled DNA oligonucleotide probe complementary to a Gag sequence. Hybridization was detected with an anti-DIG antibody conjugated to FITC. Hybridization signals were visualized by LSM5 PASCAL confocal microscope (Zeiss).
Figure 4.
Figure 4.
Analysis of Pr55Gag in 293T cells. 293T cells (3 × 10⁶) were transfected with 5 μg of pCMVGagPolRRE(myr- pro-) or 5 μg of pCMVGagPolCTE(myr- pro-) reporter constructs, with or without 1 μg of pCMVRev or 2 μg of pCMVTap and 1 μg of pcDNANXT1 as indicated. Cells were harvested at 65 h and analyzed by Western blot. The Western blot was performed on whole-cell lysates of transfected cells with an anti-p24 monoclonal antibody, and 125I-coupled protein A for detection. Brackets show the fold difference between the indicated lanes in the levels of the Pr55Gag protein bands.
Figure 5.
Figure 5.
Pulse-chase analysis of Pr55Gag protein. (A) Protein expressed from pCMVGagPolCTE(myr- pro-) in transfected 293T cells at various times posttransfection. 293T cells (3 × 10⁶) were transfected with 5 μg of pCMVGagPolCTE(myr- pro-) with or without 2 μg of pCMVTap and 1 μg of pcDNANXT1. (B) Protein expressed from pCMVGagPolRRE (myr- pro-) in transfected 293T cells at various times posttransfection. 293T cells (3 × 10⁶) were transfected with 5 μg of pCMVGagPolRRE (myr- pro-) with or without 1 μg of pCMVRev. Cells were pulsed with 35S Trans-label (methionine/cysteine) for 15 min at the indicated times after transfection and chased for 10 h. (Upper panels) Lysates were made, labeled GST-p24 was added as a recovery control, and immunoprecipitation was performed using an anti-p24 monoclonal antibody (183-H12-5C). (Lower panels) The precipitates were analyzed on a SDS polyacrylamide gel using a PhosphorImager. The locations of the immunoprecipitated Pr55Gag and the control GST-p24 protein are indicated. The amount of radioactivity in each Pr55Gag protein band is shown for each time point both before and after the chase period. The data have been normalized using the intensity of the recovery control protein GST-p24 in each sample. The analysis was performed using ImageQuant software. Band intensity units represent the radioactivity in each band derived from the pixel intensity on the PhosphorImager screen.
Figure 5.
Figure 5.
Pulse-chase analysis of Pr55Gag protein. (A) Protein expressed from pCMVGagPolCTE(myr- pro-) in transfected 293T cells at various times posttransfection. 293T cells (3 × 10⁶) were transfected with 5 μg of pCMVGagPolCTE(myr- pro-) with or without 2 μg of pCMVTap and 1 μg of pcDNANXT1. (B) Protein expressed from pCMVGagPolRRE (myr- pro-) in transfected 293T cells at various times posttransfection. 293T cells (3 × 10⁶) were transfected with 5 μg of pCMVGagPolRRE (myr- pro-) with or without 1 μg of pCMVRev. Cells were pulsed with 35S Trans-label (methionine/cysteine) for 15 min at the indicated times after transfection and chased for 10 h. (Upper panels) Lysates were made, labeled GST-p24 was added as a recovery control, and immunoprecipitation was performed using an anti-p24 monoclonal antibody (183-H12-5C). (Lower panels) The precipitates were analyzed on a SDS polyacrylamide gel using a PhosphorImager. The locations of the immunoprecipitated Pr55Gag and the control GST-p24 protein are indicated. The amount of radioactivity in each Pr55Gag protein band is shown for each time point both before and after the chase period. The data have been normalized using the intensity of the recovery control protein GST-p24 in each sample. The analysis was performed using ImageQuant software. Band intensity units represent the radioactivity in each band derived from the pixel intensity on the PhosphorImager screen.
Figure 6.
Figure 6.
Polyribosome profile analysis of GagPol mRNA. (A-D) Polyribosome profiles in transfected 293T cells. 293T cells (1 × 10⁷) were transfected with the indicated constructs as described in Figure 2, A and B. (E,F) Polyribosome profiles in B2.10 cells stably expressing GagPolCTE RNA. B2.10 cells (1 × 10⁷) that were transfected with 6 μg of pCMVTap and 3 μg of pcDNANXT1 or not transfected were analyzed. Forty-eight hours after transfection, cells were harvested and subjected to sucrose gradients centrifugation as described in Materials and Methods. The gradients were fractionated, and the O.D.254 of each fraction was measured. RNA was then prepared from each fraction by phenol extraction and assayed for GagPol or SEAP mRNA by semiquantitative RT-PCR. The absorbance profile of each gradient, as well as the RT-PCR product derived from each fraction, is shown.
Figure 7.
Figure 7.
Tap, but not NXT1, is present in the polyribosome fractions containing GagPolCTE RNA. (A) 293T cells (1 × 10⁷) were transfected with 15 μg of pCMVGagPolCTE, 6 μg of pcDNAFLAGTap, and 3 μg of pcDNANXT1 and subjected to polyribosome analysis as described in Materials and Methods. The gradients were fractionated and the O.D.254 of each fraction was measured. Proteins from each fraction were immunoprecipitated using an anti-FLAG antibody (Sigma), and the precipitates were resolved by SDS-PAGE and analyzed by Western blotting using the same anti-FLAG antibody. The bands for Tap and NXT1 proteins are indicated. (B) The same as in A, except that 15 mM EDTA was added to the lysate before gradient analysis. This has been shown to cause the dissociation of ribosomes from mRNAs without disrupting the majority of nonribosomal RNA-protein complexes (Calzone et al. 1982; Johannes and Sarnow 1998).

Similar articles

Cited by

References

    1. Antic D. and Keene, J.D. 1998. Messenger ribonucleoprotein complexes containing human ELAV proteins: Interactions with cytoskeleton and translational apparatus. J. Cell Sci. 111 (Pt 2): 183-197. - PubMed
    1. Antic D., Lu, N., and Keene, J.D. 1999. ELAV tumor antigen, Hel-N1, increases translation of neurofilament M mRNA and induces formation of neurites in human teratocarcinoma cells. Genes & Dev. 13: 449-461. - PMC - PubMed
    1. Bachi A., Braun, I.C., Rodrigues, J.P., Pante, N., Ribbeck, K., von Kobbe, C., Kutay, U., Wilm, M., Gorlich, D., Carmo-Fonseca, M., et al. 2000. The C-terminal domain of TAP interacts with the nuclear pore complex and promotes export of specific CTE-bearing RNA substrates. RNA 6: 136-158. - PMC - PubMed
    1. Bear J., Tan, W., Zolotukhin, A.S., Tabernero, C., Hudson, E.A., and Felber, B.K. 1999. Identification of novel import and export signals of human TAP, the protein that binds to the constitutive transport element of the type D retrovirus mRNAs. Mol. Cell. Biol. 19: 6306-6317. - PMC - PubMed
    1. Berkowitz R., Fisher, J., and Goff, S.P. 1996. RNA packaging. In Morphogenesis and maturation of retroviruses (ed. H.-G. Krausslich), pp. 177-218. Springer, Berlin.

Publication types

MeSH terms

Substances