Comparative Study
. 2004 Jan;134(1):215-23.
doi: 10.1104/pp.103.032607. Epub 2003 Dec 30.

Hypobaric biology: Arabidopsis gene expression at low atmospheric pressure

Affiliations
Comparative Study

Hypobaric biology: Arabidopsis gene expression at low atmospheric pressure

Anna-Lisa Paul et al. Plant Physiol. 2004 Jan.

Abstract

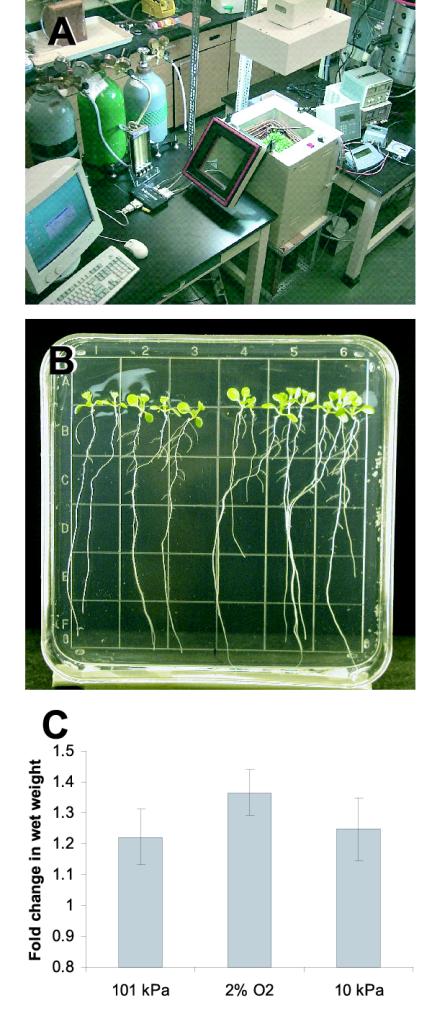
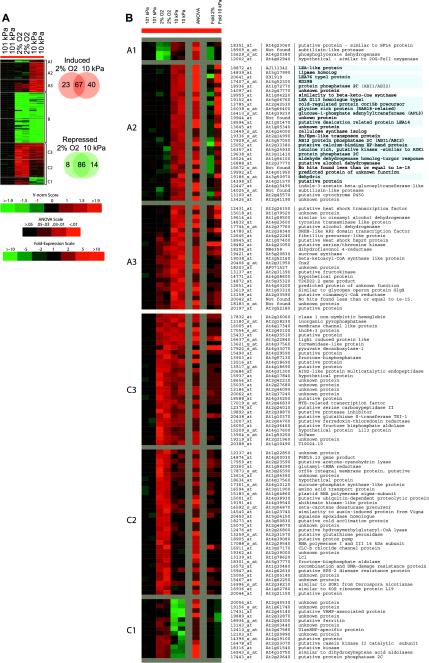
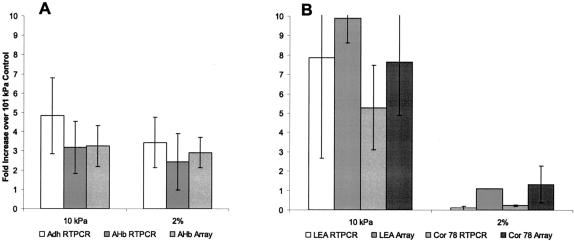
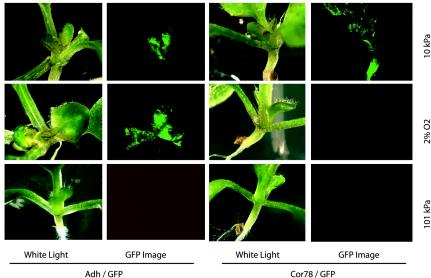
As a step in developing an understanding of plant adaptation to low atmospheric pressures, we have identified genes central to the initial response of Arabidopsis to hypobaria. Exposure of plants to an atmosphere of 10 kPa compared with the sea-level pressure of 101 kPa resulted in the significant differential expression of more than 200 genes between the two treatments. Less than one-half of the genes induced by hypobaria are similarly affected by hypoxia, suggesting that response to hypobaria is unique and is more complex than an adaptation to the reduced partial pressure of oxygen inherent to hypobaric environments. In addition, the suites of genes induced by hypobaria confirm that water movement is a paramount issue at low atmospheric pressures, because many of gene products intersect abscisic acid-related, drought-induced pathways. A motivational constituent of these experiments is the need to address the National Aeronautics and Space Administration's plans to include plants as integral components of advanced life support systems. The design of bioregenerative life support systems seeks to maximize productivity within structures engineered to minimize mass and resource consumption. Currently, there are severe limitations to producing Earth-orbital, lunar, or Martian plant growth facilities that contain Earth-normal atmospheric pressures within light, transparent structures. However, some engineering limitations can be offset by growing plants in reduced atmospheric pressures. Characterization of the hypobaric response can therefore provide data to guide systems engineering development for bioregenerative life support, as well as lead to fundamental insights into aspects of desiccation metabolism and the means by which plants monitor water relations.


Figures

Figure 1.
Figure 1.
The LPGC and the plants used for hypobaria-related experiments. A, A prototype LPGC was designed to control total pressure, gas composition, temperature, and light. B, The plants were grown on vertically oriented agar plates and, as such, had ample water supply, and the entire mass of roots and shoots was exposed to the atmospheric environment (Paul et al., 2001), before harvesting the shoots for RNA isolation and array analyses. For hypobaria, the total pressure was held at 10 kPa of Earth-normal air, whereas for hypoxia, the pressure was held at 101 kPa with flow of 98% N2:2% O2 (v/v). In all cases, the partial pressure of CO2 was held constant at 0.1 kPa, and chamber temperature was controlled to 22 ± 0.5°C. Although the relative humidity of the chamber averaged 85%, the relative humidity inside the growth plates containing the plants ranged between 95% and 100%. C, Measurements of plant biomass revealed no evidence of desiccation or any overt dehydration stress for all treatments. Seedling groups were weighed before and after 24-h experimental treatments in the LPGC. The relative change in biomass was determined for three groups of plants in each treatment set.
Figure 2.
Figure 2.
Gene expression profiles from plants treated with hypoxia and low atmospheric pressure compared with Earth-normal controls. A, The induction and repression of gene activity is represented by the variance normalized score (Vnorm) for each sample against the average of the two control samples. Only those genes demonstrating significant treatment effects are shown. The Venn diagrams show the overlap between the hypoxia and low-pressure treatments. B, The A and C clusters from the indicated regions in A are shown, with the ANOVA value for the data and the average -fold increase or decrease in gene activity, together with the gene identifiers and brief annotations. Genes directly involved in dehydration responses are indicated by blue background in the annotations. Cluster B (genes coordinately down regulated in both treatments) annotations can be found in the supplemental data.
Figure 3.
Figure 3.
Real-time RT-PCR confirmation of expression profiles. RNA samples from the same tissues used for Gene Chip arrays, as well as additional experiment replications, were subjected to real-time RT-PCR using primers directed against key genes in the hypoxia and hypobaria adaptation pathways. A, Analysis of alcohol dehydrogenase (Adh) and non-symbiotic hemoglobin (AHb). Adh and AHb represent typical hypoxia-induced genes and are consistently induced approximately 3-fold in shoots from the 10 kPa and 2% O2 treatments. B, Analysis of LEA113 and Cor78. LEA and Cor78 represent typical desiccation-related genes and are induced only in shoots from 10 kPa treatment. Treatment with 2% O2 resulted in repression of LEA and Cor78 when examined by real-time RT PCR, as indicated by values of less than one on the graphs. Error bars extending the axis are truncated, and the replicate values for the 2% O2 LEA arrays were essentially identical.
Figure 4.
Figure 4.
Specificity of the hypobaria response. Transgenic plants containing Adh/GFP and Cor78/GFP promoter fusions confirmed the selectivity of the hypobaria and hypoxia responses and highlight the tissue specificity of the gene activations revealed by the array and RT-PCR analyses. The response of Adh/GFP was essentially identical in plants exposed to 10 kPa or 2% O2 with the most responsive tissues being the young leaves surrounding the meristem. Fully expanded leaves showed a much reduced response. In contrast, the response of Cor78/GFP was markedly different between plants exposed to 10 kPa or 2% O2. Cor78/GFP was strongly induced in the central stem regions at 10 kPa, but plants at 2% O2 showed essentially no response. Plants maintained at 101 kPa showed no induction of either Adh/GFP or Cor78/GFP.

References

    1. Andre M, Massimino D (1992) Growth of plants at reduced pressures. Experiments in wheat: technological advantages and constraints. Adv Space Res 12: 97-106 - PubMed
    1. Andre M, Richaux C (1986) Can plants grow in quasi-vacuum? In CELSS 1985 Workshop, Ames Research Center. NASA Publication TM 88215: 395-404
    1. Aravind L, Koonin EV (2001) The DNA-repair protein AlkB, EGL-9, and leprecan define new families of 2-oxoglutarate- and iron-dependent dioxygenases. Genome Biol 2: 007 - PMC - PubMed
    1. Baker D (1981) The History of Spaceflight. Crown Publishers, Inc., New York
    1. Berger D, Altmann T (2000) A subtilisin-like serine protease involved in the regulation of stomatal density and distribution in Arabidopsis thaliana. Genes Dev 14: 1119-1131 - PMC - PubMed

Publication types