Comparative Study
. 2004 Jan;134(1):224-36.
doi: 10.1104/pp.103.032904. Epub 2003 Dec 30.

The CesA gene family of barley. Quantitative analysis of transcripts reveals two groups of co-expressed genes

Affiliations
Comparative Study

The CesA gene family of barley. Quantitative analysis of transcripts reveals two groups of co-expressed genes

Rachel A Burton et al. Plant Physiol. 2004 Jan.

Abstract

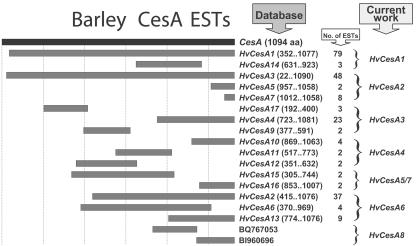
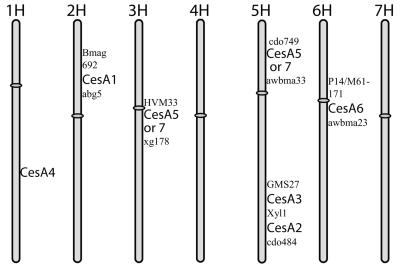
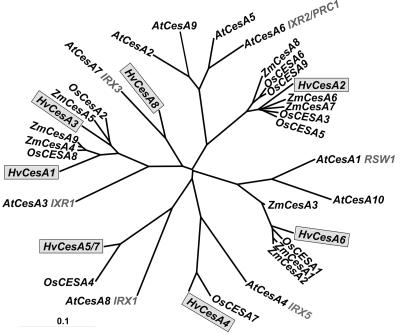
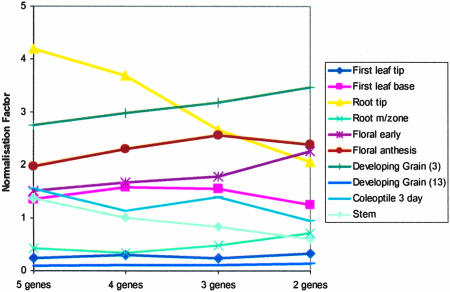
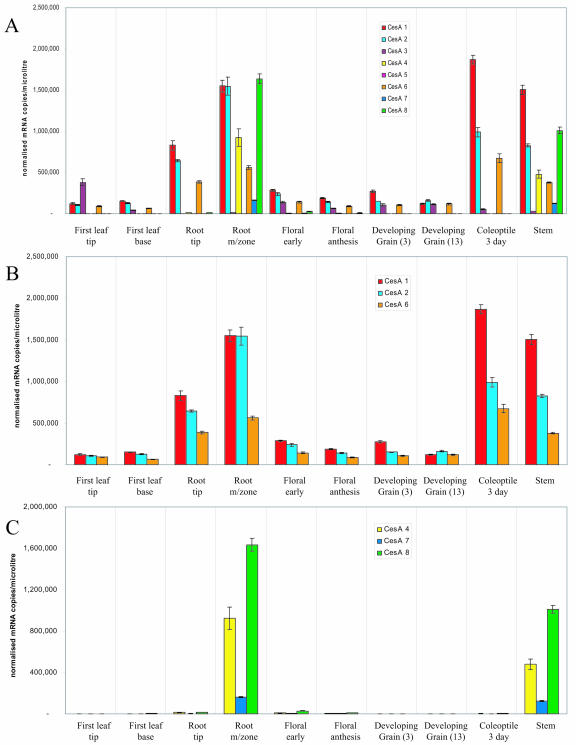
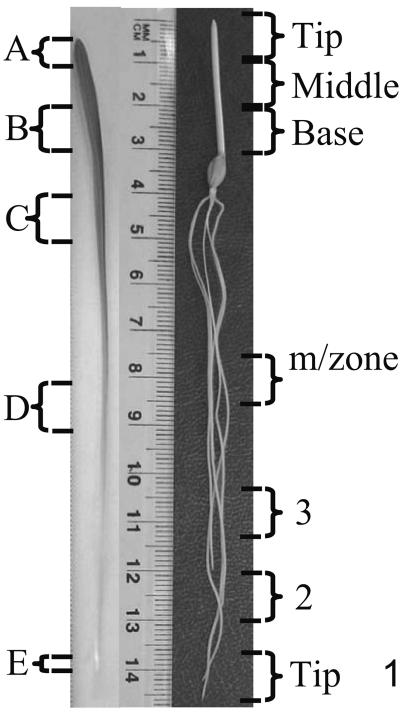
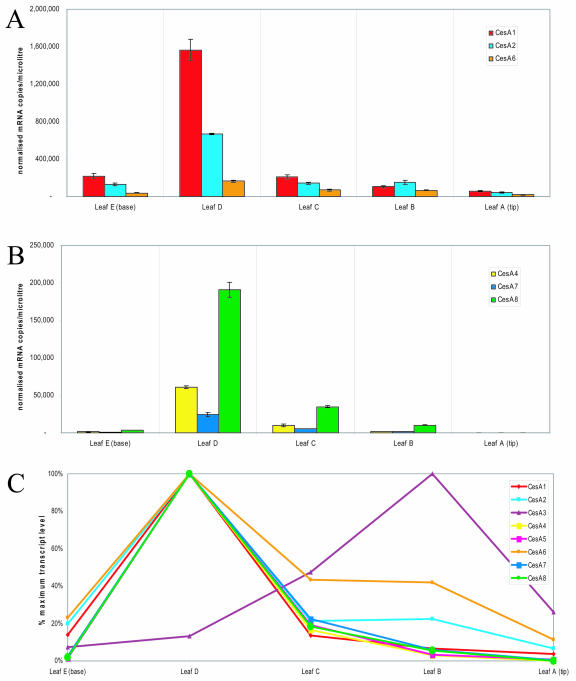
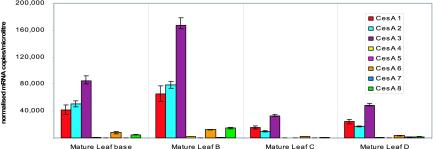
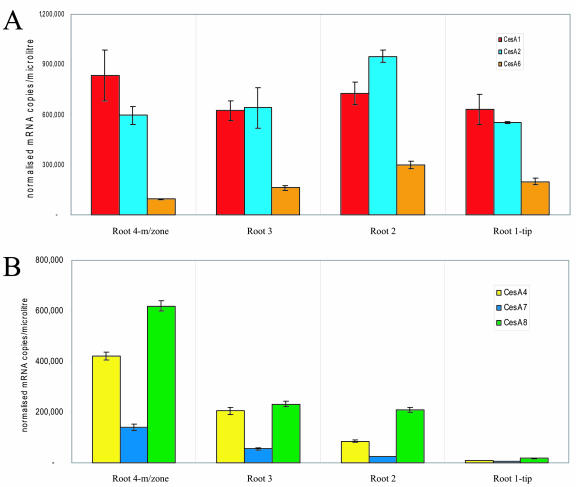
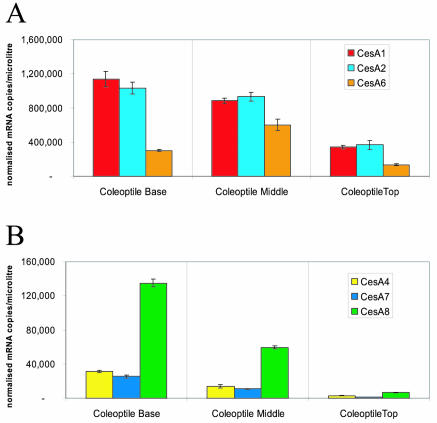
Sequence data from cDNA and genomic clones, coupled with analyses of expressed sequence tag databases, indicate that the CesA (cellulose synthase) gene family from barley (Hordeum vulgare) has at least eight members, which are distributed across the genome. Quantitative polymerase chain reaction has been used to determine the relative abundance of mRNA transcripts for individual HvCesA genes in vegetative and floral tissues, at different stages of development. To ensure accurate expression profiling, geometric averaging of multiple internal control gene transcripts has been applied for the normalization of transcript abundance. Total HvCesA mRNA levels are highest in coleoptiles, roots, and stems and much lower in floral tissues, early developing grain, and in the elongation zone of leaves. In most tissues, HvCesA1, HvCesA2, and HvCesA6 predominate, and their relative abundance is very similar; these genes appear to be coordinately transcribed. A second group, comprising HvCesA4, HvCesA7, and HvCesA8, also appears to be coordinately transcribed, most obviously in maturing stem and root tissues. The HvCesA3 expression pattern does not fall into either of these two groups, and HvCesA5 transcript levels are extremely low in all tissues. Thus, the HvCesA genes fall into two general groups of three genes with respect to mRNA abundance, and the co-expression of the groups identifies their products as candidates for the rosettes that are involved in cellulose biosynthesis at the plasma membrane. Phylogenetic analysis allows the two groups of genes to be linked with orthologous Arabidopsis CesA genes that have been implicated in primary and secondary wall synthesis.


Figures

Figure 1.
Figure 1.
Analysis of EST sequences and the barley CesA gene family. More than 314,000 barley ESTs were searched for CesA sequences and reconciled against the HvCesA genes and cDNAs cloned here (current work) and the HvCesA genes listed on the Stanford Web page (http://cellwall.stanford.edu/). The database EST sequences, with the amino acid positions in parentheses, are aligned with the cDNA sequences. The numbers of ESTs recorded in the databases for each cDNA fragment are indicated in the central column. The relatively long cDNAs cloned in the present work enabled the putative number of expressed barley HvCesA genes in the databases to be reduced from 19 to about eight.
Figure 2.
Figure 2.
Map locations for the HvCesA genes. Flanking DNA markers for each of the genes are indicated. No polymorphisms were detected for HvCesA4, which could only be mapped to the long arm of chromosome 1H. Two map positions were determined using the HvCesA5/A7 probe, but it was not possible to define which corresponded to the HvCesA5 and HvCesA7 genes. The exact positions of the genes are available on the GrainGenes Web page (http://wheat.pw.usda.gov/index.html).
Figure 3.
Figure 3.
Phylogenetic relatedness of the barley cellulose synthase (HvCesA) genes and those from Arabidopsis (AtCesA), maize (ZmCesA), and rice (OsCesA). The phylogenetic tree was generated with the ClustalX program and is based on amino acid sequence identities. Where the function of the gene has been implicated in a function relating to cellulose synthesis in Arabidopsis, the locus name is indicated (e.g. PRC1, IRX, IXR, and RSW).
Figure 4.
Figure 4.
Q-PCR NFs calculated for the cDNAs of the 10 tissues, based on the five control genes and recalculated after the sequential removal of the most variable control gene, that is the gene with the highest M value. Before the cDNA synthesis, total RNA was isolated from the ten tissues under the conditions described in “Materials and Methods.” Tissues examined include the tip and base of the first leaf (leaf tip and leaf base), the root tip and the maturation zone of roots (root m/zone), flowers just before anthesis (floral early), flowers at anthesis (floral anthesis), developing grain 3 and 13 DPA (developing grain 3 and developing grain 13), coleoptiles (3 d), and the stem of mature plants just below the emerging ear (stem).
Figure 5.
Figure 5.
Normalized expression levels of the eight HvCesA genes in a range of tissues. Levels of mRNA are presented as number of copies per microliter after normalization. Tissues and their abbreviations are as detailed in the legend to Figure 4. Error bars = sds for each mRNA. A, Levels of the eight HvCesA mRNAs in the 10 different tissues. Very low levels of HvCesA5 mRNA were detected in some tissues, but the amount could not be seen on the scale used here. B, Levels of HvCesA1, HvCesA2, and HvCesA6 transcripts in the different tissues, showing the similar relative abundance of this group of mRNAs (designated Group I). C, Levels of HvCesA4, HvCesA7, and HvCesA8 transcripts in the series of tissues, showing the similar relative abundance of this group of transcripts (designated Group II).
Figure 6.
Figure 6.
Segments of vegetative tissues used for the isolation of RNA for Q-PCR analysis of transcript abundance. The position of segments A to E of the young first leaf (7 d old) are indicated on the left, and the segments of the 5-d-old coleoptile (tip, middle, and base) and young root (maturation zone, 3, 2, and tip) are shown on the right.
Figure 7.
Figure 7.
Normalized expression levels for the barley HvCesA genes in segments of young leaves. A, Levels of the Group I transcripts, HvCesA1, HvCesA2, and HvCesA6. B, Levels of the Group II transcripts, HvCesA4, HvCesA7, and HvCesA8. C, Levels of the eight HvCesA transcripts in segments of the young leaf (Fig. 6), expressed as a percentage of maximum transcript levels of each gene. The similar transcript profile for the Groups I and II genes can be seen, but HvCesA3 transcripts are clearly distributed in a different pattern, with the highest abundance of mRNA just below the leaf tip in segment B. Error bars = sds for each mRNA.
Figure 8.
Figure 8.
Normalized expression levels for the barley HvCesA genes in segments of mature leaves. In this case, HvCesA3 transcripts are the most abundant, particularly in the middle region of the leaf. Error bars = sds for each mRNA.
Figure 9.
Figure 9.
Normalized expression levels for the barley HvCesA genes in segments of young roots. A, Levels of the Group I transcripts, HvCesA1, HvCesA2, and HvCesA6. B, Levels of the Group II transcripts, HvCesA4, HvCesA7, and HvCesA8. In this case, HvCesA3 transcripts showed a distribution similar to that for the Group II mRNAs (data not shown). The positions of the root segments are shown in Figure 6. Error bars = sds for each mRNA.
Figure 10.
Figure 10.
Normalized expression levels for the barley HvCesA genes in segments of coleoptiles. A, Levels of the Group I transcripts, HvCesA1, HvCesA2, and HvCesA6. B, Levels of the Group II transcripts, HvCesA4, HvCesA7, and HvCesA8. In this case, HvCesA3 transcripts remained at similar levels in each segment and, therefore, were different to the distribution of both the Groups I and II mRNAs (data not shown). Positions of the coleoptile segments are shown in Figure 6. Error bars = sds for each mRNA.

References

    1. Arioli T, Peng L, Betzner AS, Burn J, Wittke W, Herth W, Camilleri C, Hofte H, Plazinski J, Birch R et al. (1998) Molecular analysis of cellulose biosynthesis in Arabidopsis. Science 279: 717-720 - PubMed
    1. Beeckman T, Przemeck GHK, Stamatiou G, Lau R, Terryn N, de Rycke R, Inze D, Berleth T (2002) Genetic complexity of cellulose synthase A gene function in Arabidopsis embryogenesis. Plant Physiol 130: 1883-1893 - PMC - PubMed
    1. Burn JE, Hocart CH, Birch RJ, Cork AC, Williamson RE (2002) Functional analysis of the cellulose synthase genes CesA1, CesA2, and CesA3 in Arabidopsis. Plant Physiol 129: 797-807 - PMC - PubMed
    1. Burton RA, Gibeaut DM, Bacic A, Findlay K, Roberts K, Hamilton A, Baulcombe DC, Fincher GB (2000) Virus-induced silencing of a plant cellulose synthase gene. Plant Cell 12: 691-705 - PMC - PubMed
    1. Bustin SA (2000) Absolute quantification of mRNA using real-time reverse transcription polymerase chain reaction assays. J Mol Endocrinol 25: 169-193 - PubMed

Publication types

LinkOut - more resources