. 2004 Jan;113(1):96-105.
doi: 10.1172/JCI17763.

Inhibition of growth hormone action improves insulin sensitivity in liver IGF-1-deficient mice

Affiliations

Inhibition of growth hormone action improves insulin sensitivity in liver IGF-1-deficient mice

Shoshana Yakar et al. J Clin Invest. 2004 Jan.

Abstract

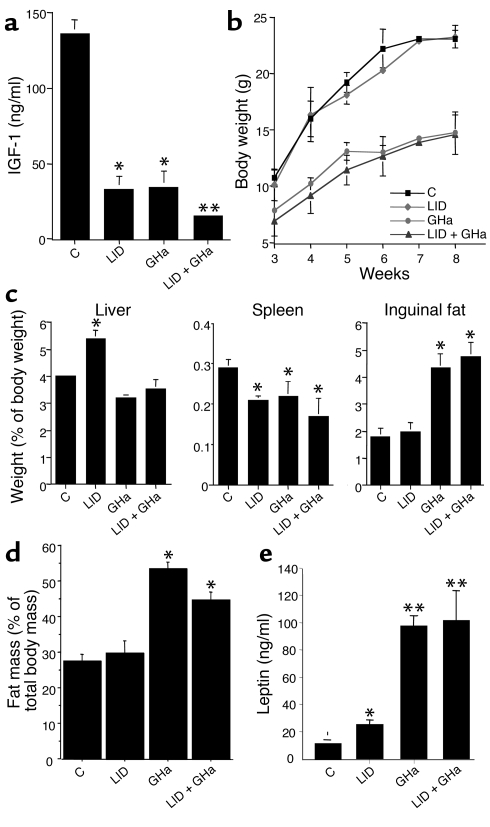
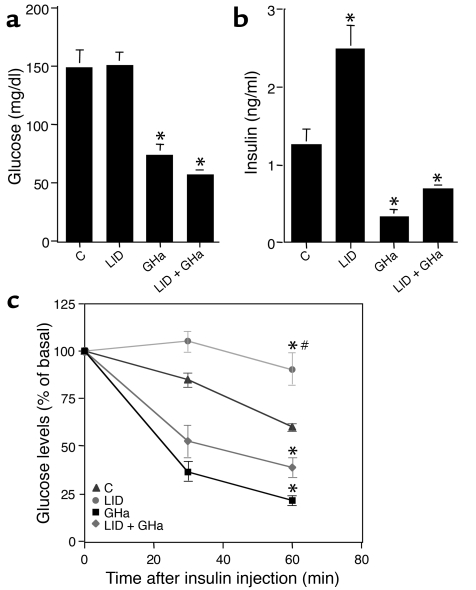
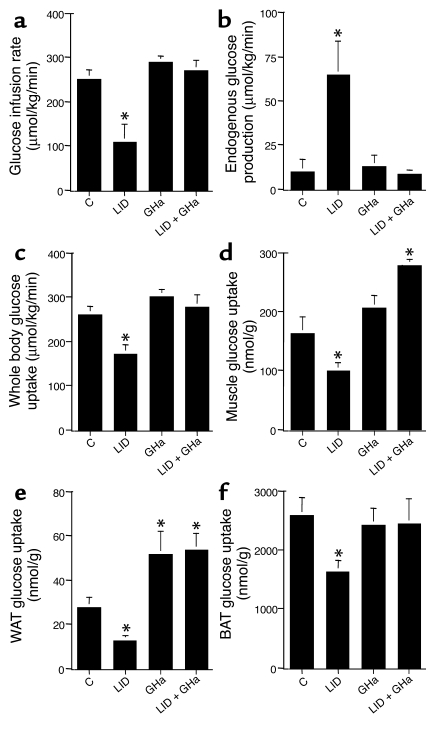
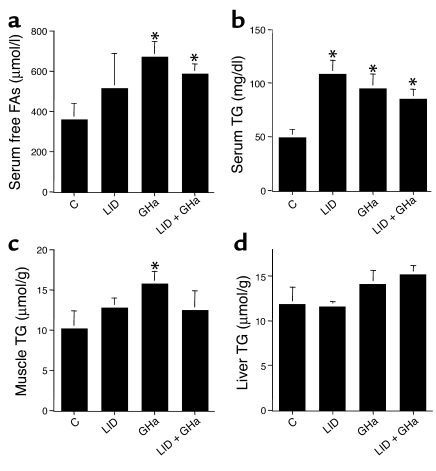
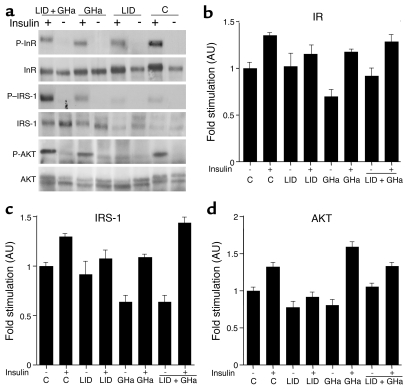
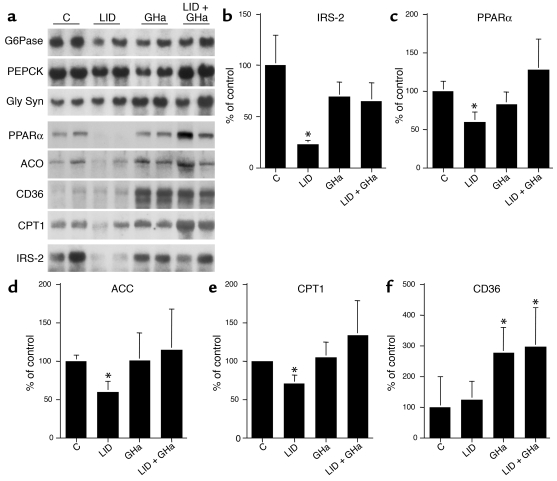
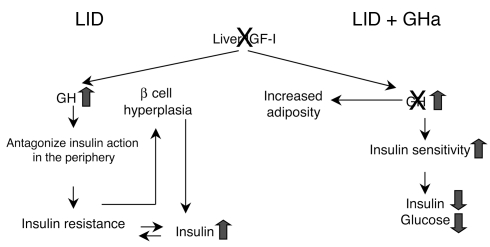
Liver IGF-1-deficient (LID) mice have a 75% reduction in circulating IGF-1 levels and, as a result, a fourfold increase in growth hormone (GH) secretion. To block GH action, LID mice were crossed with GH antagonist (GHa) transgenic mice. Inactivation of GH action in the resulting LID + GHa mice led to decreased blood glucose and insulin levels and improved peripheral insulin sensitivity. Hyperinsulinemic-euglycemic clamp studies showed that LID mice exhibit severe insulin resistance. In contrast, expression of the GH antagonist transgene in LID + GHa mice led to enhanced insulin sensitivity and increased insulin-stimulated glucose uptake in muscle and white adipose tissue. Interestingly, LID + GHa mice exhibit a twofold increase in white adipose tissue mass, as well as increased levels of serum-free fatty acids and triglycerides, but no increase in the triglyceride content of liver and muscle. In conclusion, these results show that despite low levels of circulating IGF-1, insulin sensitivity in LID mice could be improved by inactivating GH action, suggesting that chronic elevation of GH levels plays a major role in insulin resistance. These results suggest that IGF-1 plays a role in maintaining a fine balance between GH and insulin to promote normal carbohydrate and lipid metabolism.


Figures

Figure 1
Figure 1
Comparison of IGF-1 levels, body weight, and organ weight in control (C), LID, GHa, and LID + GHa mice. (a) Serum was obtained as described in Methods and treated with acid-ethanol to remove IGFBPs. Total IGF-1 levels were determined by RIA in serum samples from control mice (n = 15), LID mice (n = 21), GHa mice (n = 12), and LID + GHa mice (n = 14). *P < 0.01 compared with control mice; **P < 0.01 compared with LID or GHa mice. (b) Body weight was measured at weekly intervals from birth to the age of 12 weeks (n = 15–30 mice per group). (c) Organ weight was measured at 16–18 weeks of age and is expressed as the average percentage of body weight. Data are expressed as average ± SE. (d) Total body fat content was measured using dual-energy x-ray absorptiometry analysis of at least five mice per group. Data are expressed as average ± SE. *P < 0.01 compared with control mice. (e) Serum leptin was determined by RIA in serum samples from control mice (n = 8), LID mice (n = 8), GHa mice (n = 10), and LID + GHa mice (n = 8). *P < 0.01 compared with control mice; **P < 0.01 compared with LID mice.
Figure 2
Figure 2
LID mice expressing the GHa transgene exhibit enhanced insulin sensitivity. (a) Blood glucose levels were measured in the fed state in control, LID, GHa, and LID + GHa mice. (b) Serum insulin levels were measured in the fed state in the four genotypes. (c) Insulin tolerance tests were performed on the four genotypes of mice, as described in Methods. Results are expressed as the mean percentage of basal blood glucose concentration ± SEM. (*P < 0.05 compared with control; #P < 0.05 compared with GHa.)
Figure 3
Figure 3
Various metabolic parameters during hyperinsulinemic-euglycemic clamp of control, LID, GHa, and LID + GHa mice. (a) Average glucose infusion rates were measured during 90–120 minutes of the hyperinsulinemic-euglycemic clamp. (b) Insulin-stimulated hepatic glucose production during the hyperinsulinemic-euglycemic clamp. (c) Insulin-stimulated whole-body glucose uptake. (d) Insulin-stimulated muscle (gastrocnemius) glucose uptake. (e) Insulin-stimulated WAT glucose uptake. (f) Insulin-stimulated BAT glucose uptake. Data are expressed as average ± SE for n = 6 animals per group. (*P < 0.05 compared with control.)
Figure 4
Figure 4
Fasting concentrations of FAs and TG in serum of control, LID, GHa, and LID + GHa mice. (a) Serum FA levels were measured in the various genotypes (n = 6 mice per group). (b) TG levels were measured in the various genotypes (n = 6 mice per group). (c) Muscle TG content. (d) Liver TG content. (*P < 0.05 compared with control.)
Figure 5
Figure 5
Inactivation of insulin action in the LID mice is restored by introduction of GHa (LID + GHa mice). (a) A Western blot analysis of insulin-induced phosphorylation of the IR (b), IRS-1 (c), and AKT (d) in muscle. The levels of phosphorylation signals (P) are normalized to total immunoreactivity of IR, IGF-1R, or IRS-1 of n = 4 in each group. (*P < 0.05 compared with unstimulated samples.) AU, arbitrary units.
Figure 6
Figure 6
Analysis of mRNA levels of various genes related to glucose metabolism, lipid metabolism, and insulin signaling in livers of control, LID, GHa, and LID + GHa mice (5–6 mice per group). (a) Northern blots were used to measure G6Pase, PEPCK, glycogen synthase (Gly Syn), PPARα, ACO, CD36, CPTI, and IRS-2 mRNA levels. Average values for the mRNA levels of IRS-2 (b), PPARα (c), ACC (d), CPT1 (e), and CD36 (f) that differed between genotypes are shown in the graphs. Data are expressed as average ± SE for four animals per group, normalized to 18S RNA levels. (*P < 0.05 compared with control.)
Figure 7
Figure 7
Schematic of the effects of excess GH and inactivation of GH in LID and LID + GHa mice. Inactivation of GH action in the face of low levels of IGF-1 increases insulin sensitivity, as discussed in the text.

Comment in

References

    1. Houssay BA. The hypophysis and metabolism. N. Engl. J. Med. 1936;214:961.
    1. Moller N, et al. Effects of growth hormone on glucose metabolism. Horm. Res. 1991;36(Suppl 1):32–35. - PubMed
    1. Davidson MB. Effect of growth hormone on carbohydrate and lipid metabolism. Endocr. Rev. 1987;8:115–131. - PubMed
    1. Beauville M, et al. Effect of long-term rhGH administration in GH-deficient adults on fat cell epinephrine response. Am. J. Physiol. 1992;263:E467–E472. - PubMed
    1. Kamel A, Norgren S, Elimam A, Danielsson P, Marcus C. Effects of growth hormone treatment in obese prepubertal boys. J. Clin. Endocrinol. Metab. 2000;85:1412–1419. - PubMed

MeSH terms