. 2004 Jan;113(1):124-36.
doi: 10.1172/JCI17803.

Inefficient establishment of KSHV latency suggests an additional role for continued lytic replication in Kaposi sarcoma pathogenesis

Affiliations

Inefficient establishment of KSHV latency suggests an additional role for continued lytic replication in Kaposi sarcoma pathogenesis

Adam Grundhoff et al. J Clin Invest. 2004 Jan.

Abstract

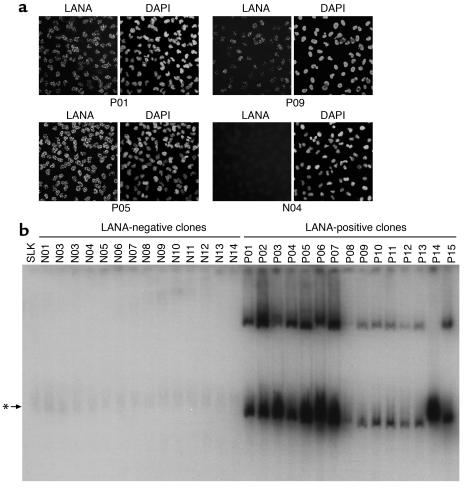
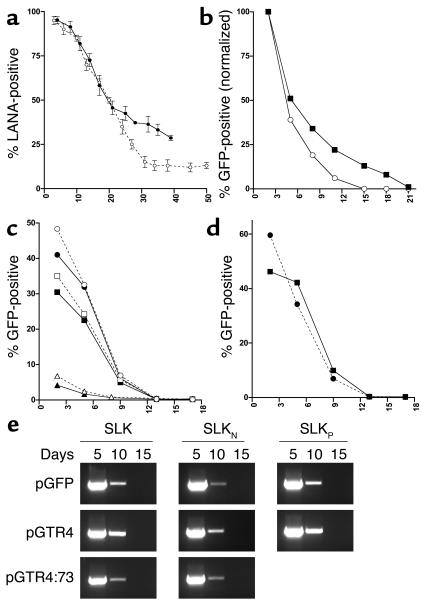
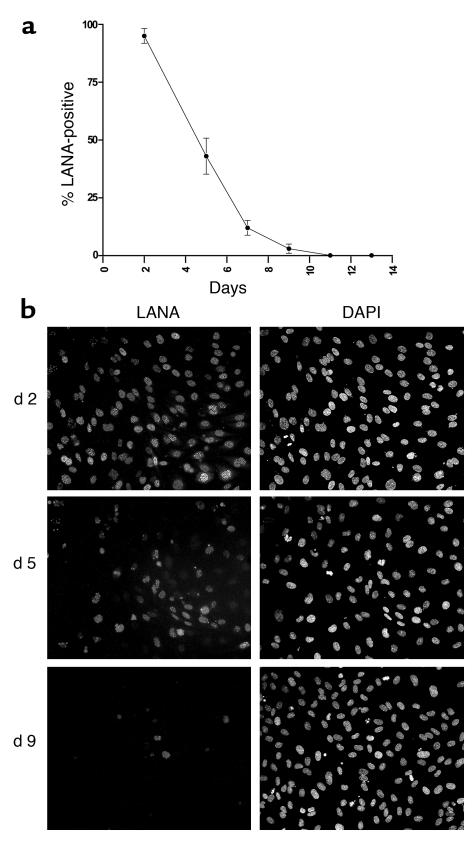
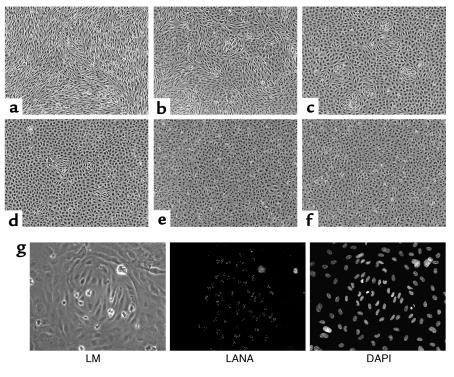
Kaposi sarcoma-associated (KS-associated) herpesvirus (KSHV) infection is linked to the development of both KS and several lymphoproliferative diseases. In all cases, the resulting tumor cells predominantly display latent viral infection. KS tumorigenesis requires ongoing lytic viral replication as well, however, for reasons that are unclear but have been suggested to involve the production of angiogenic or mitogenic factors by lytically infected cells. Here we demonstrate that proliferating cells infected with KSHV in vitro display a marked propensity to segregate latent viral genomes, with only a variable but small subpopulation being capable of stable episome maintenance. Stable maintenance is not due to the enhanced production of viral or host trans-acting factors, but is associated with cis-acting, epigenetic changes in the viral chromosome. These results indicate that acquisition of stable KSHV latency is a multistep process that proceeds with varying degrees of efficiency in different cell types. They also suggest an additional role for lytic replication in sustaining KS tumorigenesis: namely, the recruitment of new cells to latency to replace those that have segregated the viral episome.


Figures

Figure 1
Figure 1
Loss of TR-containing reporter plasmids from transfected cells. (a) Functional elements of reporter plasmids. The vector backbone pGFP contains a GFP expression cassette driven by the CMV promoter. pGTR4 contains a GFP expression cassette as well as four contiguous units of the viral terminal repeats in authentic head-to-tail orientation. Construct pGTR4:73 contains, in addition to the GFP and TR elements, a CMV promoter–driven expression cassette for ORF73/LANA. (bd) FACS analysis of cell lines transfected with the reporter plasmids described above. pGFP (open circles/dashed lines), pGTR4 (open squares/solid lines), or pGTR4:73 (filled triangles/solid lines) were introduced in SLK (b), BCBL-1 (c), or BJAB cells (d and e). BCBL-1 cells were only transfected with pGFP and pGTR4 because ORF73/LANA is provided in trans by endogenous KSHV episomes. The percentage of GFP-expressing cells was monitored over a period of 13–15 days after transfection by flow cytometry (FACS). (bd) Analyses of transfected mass cultures. For the data shown in e, BJAB cells were FACS sorted 3 days after transfection for GFP expression in order to eliminate untransfected cells.
Figure 2
Figure 2
Absence of stable episomal DNA from long-term cultures of cells transfected with TR reporter plasmids. (a) Aliquots of FACS-sorted BJAB cells transfected with the indicated reporter constructs were harvested at various time points after FACS sorting (indicated in days above the lanes) and subjected to Gardella gel analysis. Samples were derived from the same cultures shown in Figure 1e. As a control, untransfected BJAB cells were loaded in the lanes labeled BJAB. Plasmid DNA was detected with a probe specific for GFP. The band marked with an asterisk results from unspecific background hybridization, since it is also present in untransfected BJAB cells. (b) Episomal DNA was isolated from the same BJAB cultures described above by Hirt extraction and subjected to PCR amplification of the GFP cassette as described in Methods. (c) Gardella gel analysis of transfected BJAB cells cultures grown under antibiotic selection. BJAB cells were transfected with pGFP, pGTR4, or pGTR4:73 and cultured in the presence of G418. Aliquots of cells propagated for the time periods indicated above the lanes (in days) were examined for the presence of episomal DNA by Gardella analysis. Episomes were detected with a probe specific for the GFP cassette.
Figure 3
Figure 3
Efficient establishment of artificial KSHV episomes in vitro requires antibiotic selection and expression of LANA in trans. SLK73 cells were transfected with pGFP (open circles/dashed lines), pGTR4 (open squares/solid lines), or pGTR8 (filled squares/solid lines), and the transfected cultures were maintained in the presence (a) or absence (b) of G418. Cultures were analyzed at the indicated time points after transfection by FACS (left panels in a and b) or Hirt-PCR (right panels).
Figure 4
Figure 4
Loss of LANA-positive cells in cultures infected with KSHV in vitro. The indicated cell lines were infected with viral supernatants from lytically induced BCBL-1 cells as described in Methods. Cells were cultured for 30–50 days after infection, and the percentage of LANA-positive cells was evaluated every 3–6 days by IFA.
Figure 5
Figure 5
Gardella gel analysis of in vitro–infected SLK and TIME cells. Aliquots from KSHV-infected TIME (a) or SLK (b) cultures were evaluated by Gardella gel analysis at various time points after infection (indicated in days above the lanes) and KSHV episomes were detected using a LANA-specific probe. As a control, BCBL-1 cells were loaded in the leftmost and rightmost lanes in a and b, respectively. BCBL-1 cells were either untreated (lanes labeled BCBL-1) or treated with TPA and ionomycin (lanes labeled BCBL-1 ind.) for lytic cycle induction. The position of supercoiled episomes (upper band) and linear as well as nicked and partially degraded KSHV DNA (lower band) are marked by arrows labeled sup and lin, respectively. Note that the band marked with an asterisk in a, migrating slightly above the linear viral DNA, results from nonspecific background hybridization, because it is also present in the uninfected TIME cells loaded in lane 3. TPA/ionomycin-treated BCBL-1 samples show an increase in intensity of the lower (linear) band relative to uninduced BCBL-1 cells due to lytic replication and production of virus particles harboring linear KSHV genomes. (Note: Since spontaneous lytic replication does not occur in SLK [55], the linear DNA in b likely derives from fragmentation of circular KSHV genomes during handling and electrophoresis). infect., infected; ind., lytic cycle induction.
Figure 6
Figure 6
KSHV-positive and KSHV-negative single cell clones derived from infected SLK mass cultures. SLK cells that had been cultured for 65 days following infection were subjected to single-cell cloning by limiting dilution. (a) Representative immunofluorescence pictures of three LANA-positive single-cell clones (P01, P05, and P09) as well as one LANA-negative clone (N04). LANA was detected with a polyclonal antiserum (left picture in each panel), and nuclei were stained with DAPI (right picture). (b) Gardella analysis of 14 LANA-negative (N01–N14) and 15 LANA-positive (P01–P15) single-cell clones derived from infected mass cultures. Uninfected SLK cells were loaded as a control in the leftmost lane. The arrow marked with an asterisk indicates the position of a background band that is also present in uninfected SLK control cells. KSHV episomes were detected using a probe specific for ORF73/LANA.
Figure 7
Figure 7
Analysis of SLKP and SLKN cells. (a) SLKN cells were infected with viral supernatants from lytically induced BCBL-1 cells. The percentage of LANA-positive cells was evaluated over a period of 40 days by IFA (solid line). The curve obtained from the initial infection of the parental SLK mass cultures (see Figure 4) is shown for comparison (dashed line). (b) SLKN (open circles) or SLKP cells (filled squares) were infected with recombinant KSHV-GFP supernatants, and the percentage of GFP-positive cells was analyzed by FACS over a period of 3 weeks. Shown are normalized percentages relative to the initial infection level (absolute infection efficiencies were 2.9% and 4.2% for SLKN and SLKP cells, respectively). (c) SLKN cells (solid lines, filled symbols) or uninfected SLK cells (dashed lines, open symbols) were transfected with the reporter constructs pGFP (circles), pGTR4 (squares), or pGTR4:73 (triangles). The percentage of GFP-expressing cells was monitored over a period of 17 days after transfection by FACS. (d) SLKP cells were transfected with pGFP (circles) or pGTR4 (squares) and analyzed by FACS over a period of 17 days. (e) PCR analysis of the transfected SLK, SLKN, and SLKP cultures described above. Episomal DNA was isolated at the time points indicated (in days) above the lanes by Hirt extraction and subjected to PCR amplification of the GFP cassette as described in Methods.
Figure 8
Figure 8
Loss of KSHV-positive cells in continuously growing HUVEC cultures. HUVEC cells were infected with KSHV in vitro and passaged every 2 to 3 days for a period of 2 weeks. (a) Graph showing the percentage of LANA-positive cells at each passage as judged by IFA. (b) Representative immunofluorescence pictures of cultures at 2, 5, or 9 days after infection stained for LANA (left picture in each complement) or nuclei (right pictures).
Figure 9
Figure 9
Loss of spindle cell morphology correlates with loss of KSHV episomes in KSHV-infected HUVEC cultures. At each passage, aliquots of the continuously growing KSHV-infected HUVEC cultures shown in Figure 6a were allowed to reach confluence and maintained for an additional 4 days to allow for complete conversion of infected cells to spindle cell morphology. Shown are cultures seeded at passage 1 (day 2 after infection (a), passage 2 (day 5 after infection) (b), passage 3 (day 7 after infection) (c), passage 4 (day 9 after infection) (d), and passage 5 (day 13 after infection) (e). An image of a mock-infected culture propagated in parallel is shown (f). (g) Cluster of spindle-shaped cells from a culture seeded at day 7 after infection analyzed by light microscopy (LM, left) and immunofluorescence staining for LANA (center). Nuclei were stained with DAPI (right).

Comment in

  • New viruses shake old paradigms.
    Wang CY, Sugden B. Wang CY, et al. J Clin Invest. 2004 Jan;113(1):21-3. doi: 10.1172/JCI20662. J Clin Invest. 2004. PMID: 14702103 Free PMC article.

References

    1. Herndier B, Ganem D. The biology of Kaposi’s sarcoma. Cancer Treat. Res. 2001;104:89–126. - PubMed
    1. Delabesse E, et al. Molecular analysis of clonality in Kaposi’s sarcoma. J. Clin. Pathol. 1997;50:664–668. - PMC - PubMed
    1. Gill PS, et al. Evidence for multiclonality in multicentric Kaposi’s sarcoma. Proc. Natl. Acad. Sci. U. S. A. 1998;95:8257–8261. - PMC - PubMed
    1. Judde JG, et al. Monoclonality or oligoclonality of human herpesvirus 8 terminal repeat sequences in Kaposi’s sarcoma and other diseases. J. Natl. Cancer Inst. 2000;92:729–736. - PubMed
    1. Corbeil J, Evans LA, Vasak E, Cooper DA, Penny R. Culture and properties of cells derived from Kaposi sarcoma. J. Immunol. 1991;146:2972–2976. - PubMed

Substances