. 2004 Jan 2;32(1):82-92.
doi: 10.1093/nar/gkh173. Print 2004.

Structural and biochemical analyses of hemimethylated DNA binding by the SeqA protein

Affiliations

Structural and biochemical analyses of hemimethylated DNA binding by the SeqA protein

Norie Fujikawa et al. Nucleic Acids Res. .

Erratum in

  • Nucleic Acids Res. 2004 Jan;32(2):865

Abstract

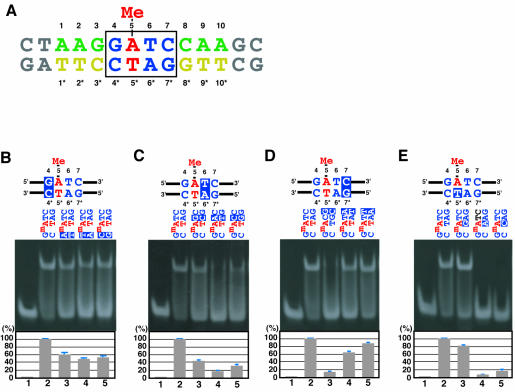
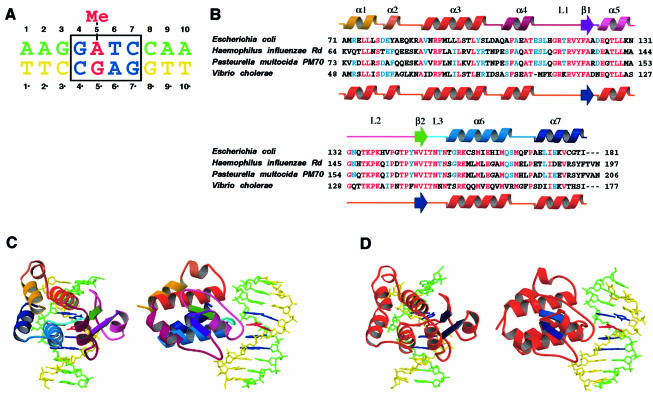
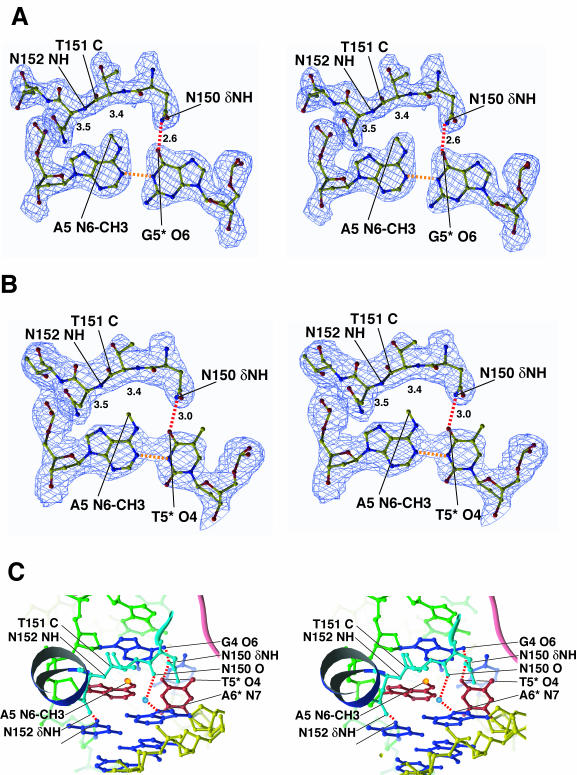
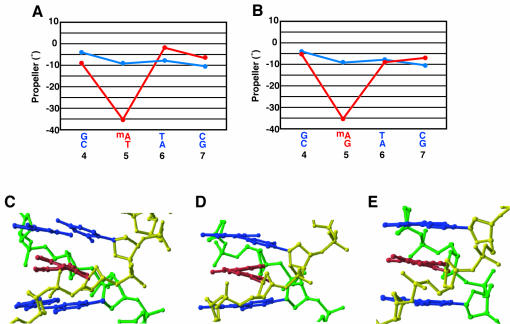
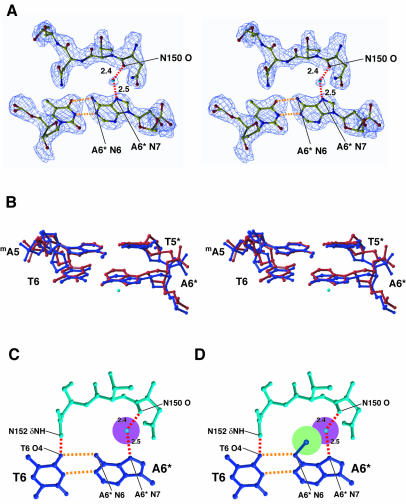
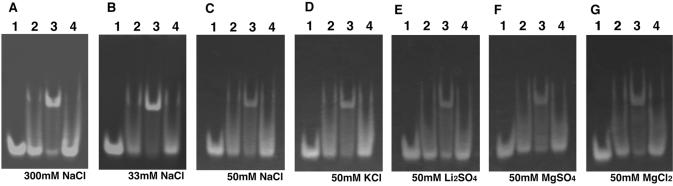
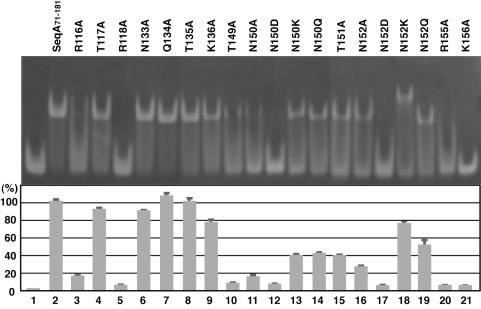
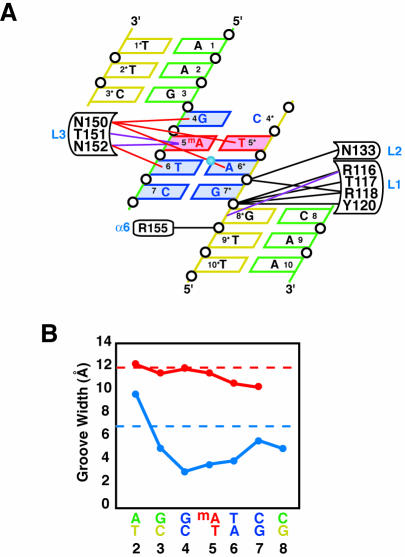
The Escherichia coli SeqA protein recognizes the 11 hemimethylated G-mA-T-C sites in the oriC region of the chromosome, and prevents replication over-initiation within one cell cycle. The crystal structure of the SeqA C-terminal domain with hemimethylated DNA revealed the N6-methyladenine recognition mechanism; however, the mechanism of discrimination between the hemimethylated and fully methylated states has remained elusive. In the present study, we performed mutational analyses of hemimethylated G-mA-T-C sequences with the minimal DNA-binding domain of SeqA (SeqA71-181), and found that SeqA71-181 specifically binds to hemimethylated DNA containing a sequence with a mismatched mA:G base pair [G-mA(:G)-T-C] as efficiently as the normal hemimethylated G-mA(:T)-T-C sequence. We determined the crystal structures of SeqA71-181 complexed with the mismatched and normal hemimethylated DNAs at 2.5 and 3.0 A resolutions, respectively, and found that the mismatched mA:G base pair and the normal mA:T base pair are recognized by SeqA in a similar manner. Furthermore, in both crystal structures, an electron density is present near the unmethylated adenine, which is only methylated in the fully methylated state. This electron density, which may be due to a water molecule or a metal ion, can exist in the hemimethylated state, but not in the fully methylated state, because of steric clash with the additional methyl group.


Figures

Figure 1
Figure 1
SeqA71–181–DNA binding analyses. (A) The hemimethylated G-mA-T-C 14mer DNA used in the DNA binding analysis. The region corresponding to the hemimethylated G-mA-T-C 10mer DNA used in the crystallization of the SeqA71–181–DNA complex is colored, and is numbered. The recognition sequence of SeqA is colored blue in the box, and the hemimethylated mA:T base pair is colored red. ‘Me’ indicates the N6-methyl group. Numbers without asterisks indicate base positions from the 5′ end of the methylated strand, and numbers with asterisks indicate base positions from the 3′ end of the unmethylated strand. (B–D) Effect of base pair replacements at the G4:C4* (B), T6:A6* (C) and C7:G7* (D) base pairs. Replaced base pairs are indicated by white letters on the top of each panel. Lane 1 is a negative control experiment without protein, and lane 2 is a positive control. (E) Effect of mismatch replacements at the mA5:T5* position on the DNA binding. Lane 1 is a negative control experiment without protein, and lane 2 is a positive control. The T5* residue was replaced by G (lane 3), A (lane 4) and C (lane 5). Graphic representations of the DNA binding of the SeqA71–181 mutants are presented in the bottom panels (B–E). The amounts of complex formation relative to that accomplished by the wild-type SeqA71–181 protein are presented. Average and SD values from three independent experiments are presented.
Figure 2
Figure 2
Crystal structures of SeqA71–181 complexed with a T5*G mismatch hemimethylated DNA and a normal hemimethylated DNA. (A) The T5*G mismatch hemimethylated G-mA-T-C DNA used in the structural analysis of the SeqA71–181–DNA complex. The recognition sequence of SeqA is colored blue in the box, and the hemimethylated mA:T base pair is colored red. ‘Me’ indicates the N6-methyl group. Numbers without asterisks indicate base positions from the 5′ end of the methylated strand, and numbers with asterisks indicate base positions from the 3′ end of the unmethylated strand. (B) Secondary structure of SeqA71–181. The amino acid sequences from the Haemophilus influenzae Rd, Pasteurella multocida PM70 and Vibrio cholerae SeqA proteins, corresponding to the E.coli SeqA71–181 protein, are aligned. The α-helix and β-sheet regions are indicated by yellow and green boxes, respectively. Conserved and semi- conserved amino acid residues are indicated by red and blue letters, respectively. The secondary structure of SeqA71–181 complexed with the T5*G mismatch hemimethylated DNA is presented in the top row, and that with the authentic hemimethylated DNA is presented in the bottom row. (C) Overall structures of the SeqA71–181–T5*G hemimethylated DNA complex. Top and side views are shown. The DNA strand containing the N6-methyladenine is shown in green, and its complementary strand is shown in yellow. The recognition bases are colored blue, and the hemimethylated mA:T base pairs are shown in red. The colors of the protein correspond to those in (B). (D) Overall structures of the SeqA71–181–hemimethylated DNA complex. Top and side views are shown.
Figure 3
Figure 3
The SeqA–DNA interactions. (A) Stereo view of the (2|Fo| – |Fc|) electron density map for the L3 loop and the mA5:G5* base pair. The hydrogen bond between the base pair is represented by the yellow dashed line, and the hydrogen bond between Asn150 and G5* is indicated by the red dashed line. The number on the red dashed line indicates the length (Å) of the hydrogen bond. The purple arrows indicate van der Waals interactions, and the numbers on the purple arrows indicate the distances (Å) between the main chain CO group of Thr151 or the NH group of Asn152 and the methyl group. (B) Stereo view of the (2|Fo| – |Fc|) electron density map for the L3 loop and the mA5:T5* base pair. (C) Stereo view of the interactions between the L3 loop and the major groove of the hemimethylated mA:T base pair. Colors correspond to those in Figure 2C and D. The hemimethylated mA:T base pair is colored red, and the N6-methyl group of A5 is presented in a gold sphere. Red dashed lines indicate hydrogen bonds, and purple arrows indicate van der Waals interactions with the N6-methyl group of A5. The water molecule bound by the hydrogen bonds is presented in a blue sphere.
Figure 4
Figure 4
The DNA structure in the SeqA71–181–DNA complex. (A) Graphic representation of the base propeller angles of the authentic hemimethylated DNA, calculated by CURVES (31). (B) Graphic representation of the base propeller angles of the T5*G hemimethylated DNA, calculated by CURVES (31). The vertical axis indicates the propeller angle of each base pair, and the horizontal axis indicates the base number. The red and blue lines indicate the propeller angles of the SeqA71–181-bound hemimethylated DNA and the protein-free hemimethylated DNA (24), respectively. (C–E) Structural comparison of the SeqA71–181-bound hemimethylated DNA (C), the SeqA71–181-bound T5*G hemimethylated DNA (D) and the protein-free hemimethylated DNA (E). The recognition bases are colored blue, and the methylated and unmethylated strands are presented in green and yellow, respectively.
Figure 5
Figure 5
Discrimination of the hemimethylated state from the fully methylated and unmethylated states. (A) Stereo view of the (2|Fo| – |Fc|) electron density map for the L3 loop and the T6:A6* base pair. The hydrogen bonds between the base pair are represented by yellow dashed lines, and the water-mediated hydrogen bonds between Asn150 and A6* are indicated by red dashed lines. The water molecule is presented in a blue sphere. The numbers on the red dashed lines indicate the lengths (Å) of the hydrogen bonds. (B) Stereo view of the hemimethylated A:T and non-methylated T:A base pairs complexed with SeqA. The mA5:T5* and T6:A6* base pairs of the SeqA71–181·10mer complex (red) were superimposed on those of the SeqA51–181·12mer complex (; blue). (C) The interaction between the L3 loop and the T6:A6* base pair found in the present complex structure. (D) The N6-methyl group is modeled at A6*, which is methylated in the fully methylated state. The van der Waals radii of the oxygen (1.4 Å) of the water molecule and the methyl group (2.0 Å) are indicated in purple and green circles, respectively.
Figure 6
Figure 6
Effects of salt concentration and species on SeqA71–181–DNA binding. Double-stranded 14mer oligonucleotides were used in the DNA binding assay. The unmethylated (lane 2), hemimethylated (lane 3) and fully methylated (lane 4) double-stranded oligonucleotides (80 pmol) were incubated with SeqA71–181 (200 pmol) at 37°C in the presence of the indicated amounts of salts. After a 30 min incubation, the samples were directly analyzed by 12% polyacrylamide gel electrophoresis in 1× TBE buffer (90 mM Tris-borate and 2 mM EDTA) run at 3 V/cm for 60 min. Lane 1 indicates a negative control experiment without protein. The DNA bands were visualized by ethidium bromide staining. (A) 300 mM NaCl, (B) 30 mM NaCl, (C) 50 mM NaCl, (D) 50 mM KCl, (E) 50 mM Li2SO4, (F) 50 mM MgSO4 and (G) 50 mM MgCl2.
Figure 7
Figure 7
Mutational analysis of SeqA71–181. The SeqA71–181–DNA interactions were assessed by gel-shift analyses. A hemimethylated DNA substrate containing a G-mA-T-C site at the center was used as the substrate. Lane 1 is a negative control experiment without protein, and lane 2 is a positive control. Graphic representations of the DNA binding by the SeqA71–181 mutants are presented in the bottom panel. The amount of complex formation relative to that formed by the wild-type SeqA71–181 protein is presented. Average and SD values from three independent experiments are presented. Lanes 3–21 are the experiments with the SeqA71–181 mutants, R116A, T117A, R118A, N133A, Q134A, T135A, K136A, T149A, N150A, N150D, N150K, N150Q, T151A, N152A, N152D, N152K, N152Q, R155A and K156A, respectively.
Figure 8
Figure 8
The protein–DNA interactions and the DNA distortion in the SeqA71–181·DNA complex. (A) Schematic diagram summarizing the DNA contacts by SeqA71–181. The colors of the DNA correspond to those in Figure 2. Open circles represent phosphates. Hydrogen bonds and salt bridges with the backbone phosphate groups are indicated with black lines. Specific recognitions of bases are shown by red (hydrogen bonds) and purple (van der Waals interactions) lines. (B) The widths of the major and minor grooves, calculated by CURVES (31), are plotted against the base number. The red and blue lines indicate the widths of the major and minor grooves, respectively. The red and blue dashed lines indicate the average width of the major and minor grooves, respectively, in the authentic B-form DNA.

Similar articles

Cited by

References

    1. Crooke E. (1995) Regulation of chromosomal replication in E.coli: sequestration and beyond. Cell, 82, 877–880. - PubMed
    1. Henaut A., Rouxel,T., Gleizes,A., Moszer,I. and Danchin,A. (1996) Uneven distribution of GATC motifs in the Escherichia coli chromosome, its plasmids and its phages. J. Mol. Biol., 257, 574–585. - PubMed
    1. Messer W., Billekes,U. and Lother,H. (1985) Effect of dam methylation on the activity of the E.coli replication origin, oriC. EMBO J., 4, 1327–1332. - PMC - PubMed
    1. Messer W. and Weigel,C. (1996) Initiation of chromosome replication. In Neidhardt,F.C., Curtiss,R.,III, Ingraham,J., Lin,E.C.C., Low,K.B., Magasanik,B., Reznikoff,W.S., Riley,M., Schaechter,M. and Umbarger,H.E. (eds), Escherichia coli and Salmonella typhimurium: Cellular and Molecular Biology, 2nd Edn. ASM Press, Washington, DC, pp. 1579–1601.
    1. vonFreiesleben U., Rasmussen,K.V. and Schaechter,M. (1994) SeqA limits DnaA activity in replication from oriC in Escherichia coli. Mol. Microbiol., 14, 763–772. - PubMed

Publication types

MeSH terms