

Lipid bilayers: thermodynamics, structure, fluctuations, and interactions
- PMID: 14706737
- PMCID: PMC2730738
- DOI: 10.1016/j.chemphyslip.2003.09.002
Lipid bilayers: thermodynamics, structure, fluctuations, and interactions
Abstract
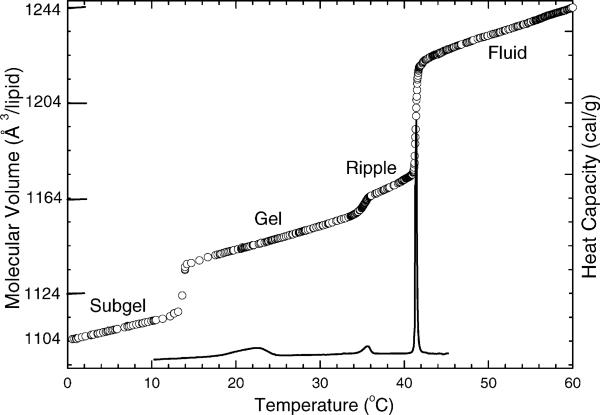
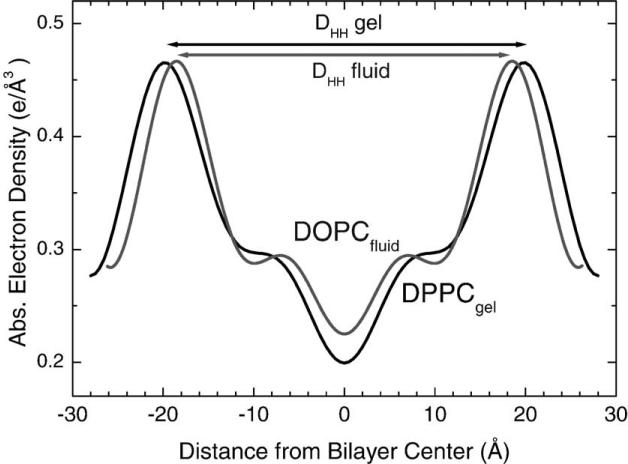
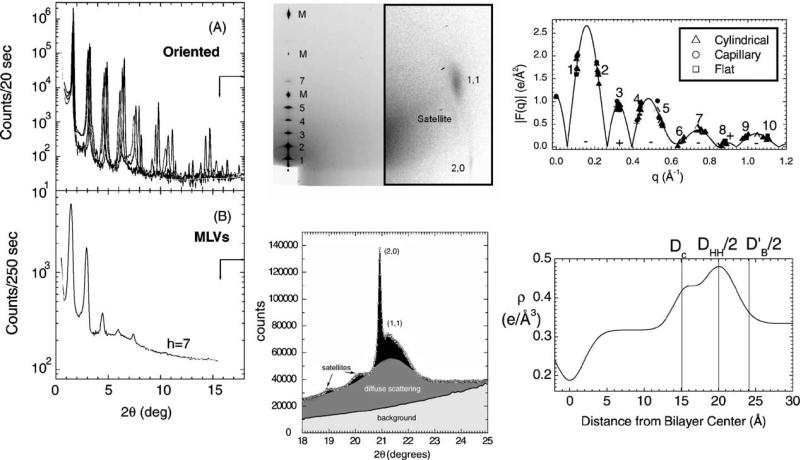
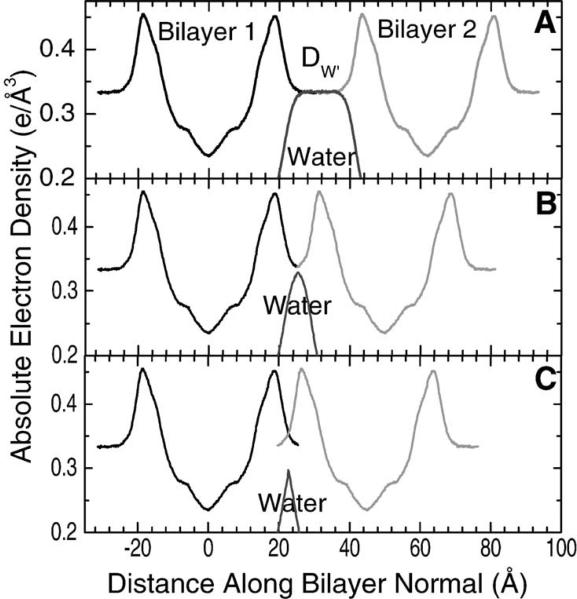
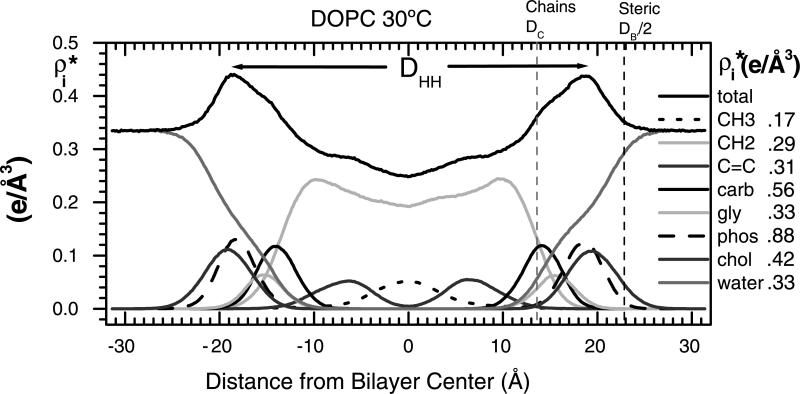
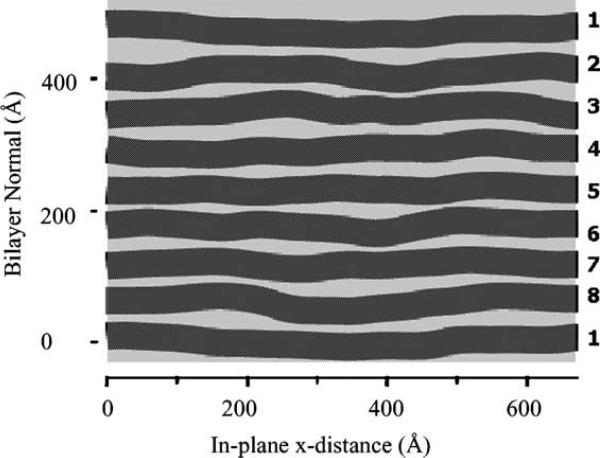
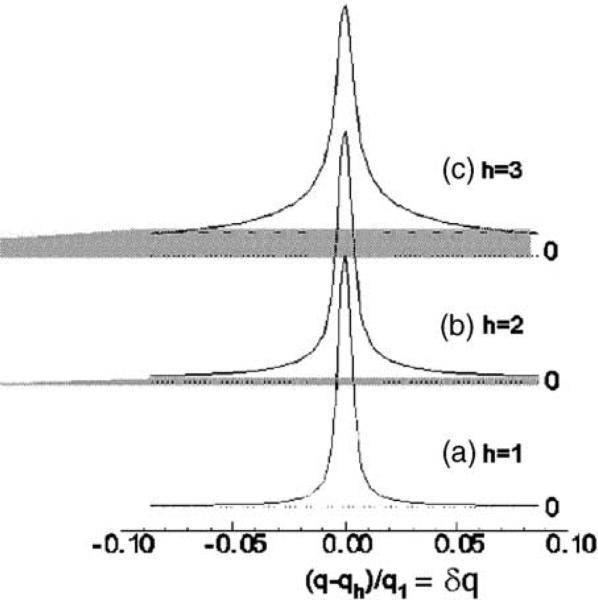
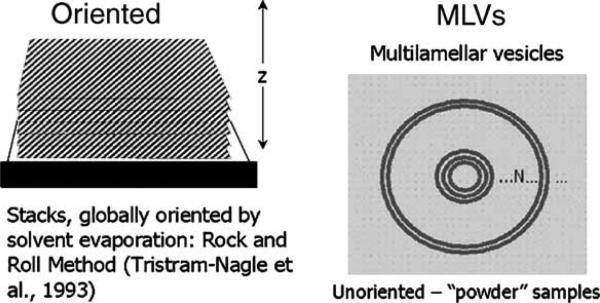
This article, adapted from our acceptance speech of the Avanti Award in Lipids at the 47th Biophysical Society meeting in San Antonio, 2003, summarizes over 30 years of research in the area of lipid bilayers. Beginning with a theoretical model of the phase transition (J.F.N.), we have proceeded experimentally using dilatometry and density centrifugation to study volume, differential scanning calorimetry to study heat capacity, and X-ray scattering techniques to study structure of lipid bilayers as a function of temperature. Electron density profiles of the gel and ripple phases have been obtained as well as profiles from several fluid phase lipids, which lead to many structural results that compliment molecular dynamics simulations from other groups. Using the theory of liquid crystallography plus oriented lipid samples, we are the first group to obtain both material parameters (KC and B) associated with the fluctuations in fluid phase lipids. This allows us to use fully hydrated lipid samples, as in vivo, to obtain the structure.
Figures

Similar articles
-
X-ray structure, thermodynamics, elastic properties and MD simulations of cardiolipin/dimyristoylphosphatidylcholine mixed membranes.Chem Phys Lipids. 2014 Feb;178:1-10. doi: 10.1016/j.chemphyslip.2013.12.010. Epub 2013 Dec 28. Chem Phys Lipids. 2014. PMID: 24378240 Free PMC article.
-
Characterization of complexes formed in fully hydrated dispersions of dipalmitoyl derivatives of phosphatidylcholine and diacylglycerol.Biophys J. 1995 Apr;68(4):1374-82. doi: 10.1016/S0006-3495(95)80310-3. Biophys J. 1995. PMID: 7787023 Free PMC article.
-
Structure and thermotropic properties of 1-stearoyl-2-acetyl-phosphatidylcholine bilayer membranes.Biophys J. 1994 May;66(5):1469-78. doi: 10.1016/S0006-3495(94)80937-3. Biophys J. 1994. PMID: 8061196 Free PMC article.
-
Structure of lipid bilayers.Biochim Biophys Acta. 2000 Nov 10;1469(3):159-95. doi: 10.1016/s0304-4157(00)00016-2. Biochim Biophys Acta. 2000. PMID: 11063882 Free PMC article. Review.
-
Differential scanning calorimetry in the study of lipid phase transitions in model and biological membranes: practical considerations.Methods Mol Biol. 2007;400:171-95. doi: 10.1007/978-1-59745-519-0_12. Methods Mol Biol. 2007. PMID: 17951734 Review.
Cited by
-
Residue-specific membrane location of peptides and proteins using specifically and extensively deuterated lipids and ¹³C-²H rotational-echo double-resonance solid-state NMR.J Biomol NMR. 2013 Jan;55(1):11-7. doi: 10.1007/s10858-012-9692-8. Epub 2012 Dec 8. J Biomol NMR. 2013. PMID: 23225071 Free PMC article.
-
Influence of the Molecular Weight and the Presence of Calcium Ions on the Molecular Interaction of Hyaluronan and DPPC.Molecules. 2020 Aug 27;25(17):3907. doi: 10.3390/molecules25173907. Molecules. 2020. PMID: 32867196 Free PMC article.
-
Introductory lecture: basic quantities in model biomembranes.Faraday Discuss. 2013;161:11-29; discussion 113-50. doi: 10.1039/c2fd20121f. Faraday Discuss. 2013. PMID: 23805735 Free PMC article.
-
A call to order: Examining structured domains in biomolecular condensates.J Magn Reson. 2023 Jan;346:107318. doi: 10.1016/j.jmr.2022.107318. J Magn Reson. 2023. PMID: 36657879 Free PMC article.
-
Effects of monovalent anions of the hofmeister series on DPPC lipid bilayers Part I: swelling and in-plane equations of state.Biophys J. 2007 Sep 1;93(5):1580-90. doi: 10.1529/biophysj.106.094482. Epub 2007 May 11. Biophys J. 2007. PMID: 17496051 Free PMC article.
References
-
- Als-Nielsen J, Litster JD, Birgeneau RJ, Kaplan M, Safinya CR, Lindegaad-Anderson A, Mathiesen S. Observation of algebraic decay of positional order in a smectic liquid crystal. Phys. Rev. B. 1980;22:312–320.
-
- Blaurock AE, McIntosh TJ. Structure of the crystalline bilayer in the subgel phase of dipalmitoylphosphatidylglycerol. Biochemistry. 1986;25:299–305. - PubMed
-
- Caillé A. Crystalline physics. remarks on the X-ray scattering of smectic A phases. C.R. Acad. Sci. Paris Ser. B. 1972;274:891–893.
Publication types
MeSH terms
Substances
Grants and funding
LinkOut - more resources
Full Text Sources
