. 2004 Jan 5;199(1):59-68.
doi: 10.1084/jem.20031175.

Gene expression profiling of hairy cell leukemia reveals a phenotype related to memory B cells with altered expression of chemokine and adhesion receptors

Affiliations

Gene expression profiling of hairy cell leukemia reveals a phenotype related to memory B cells with altered expression of chemokine and adhesion receptors

Katia Basso et al. J Exp Med. .

Abstract

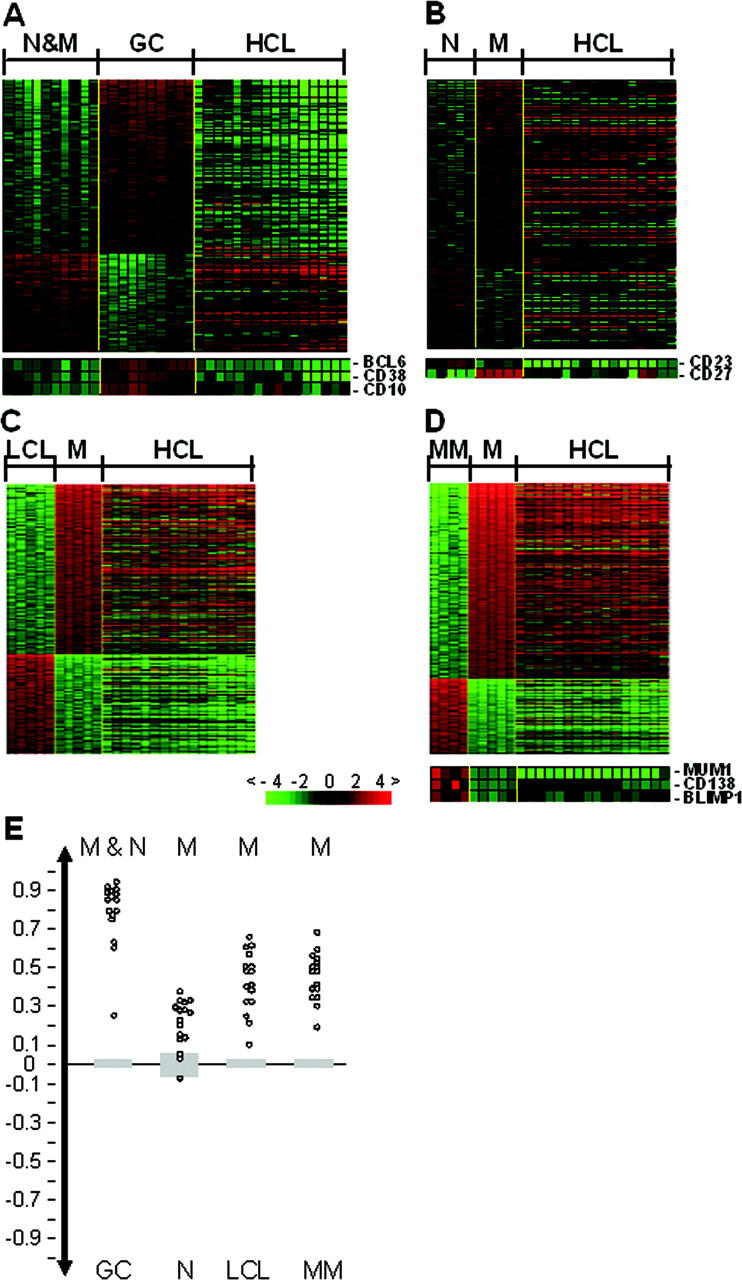
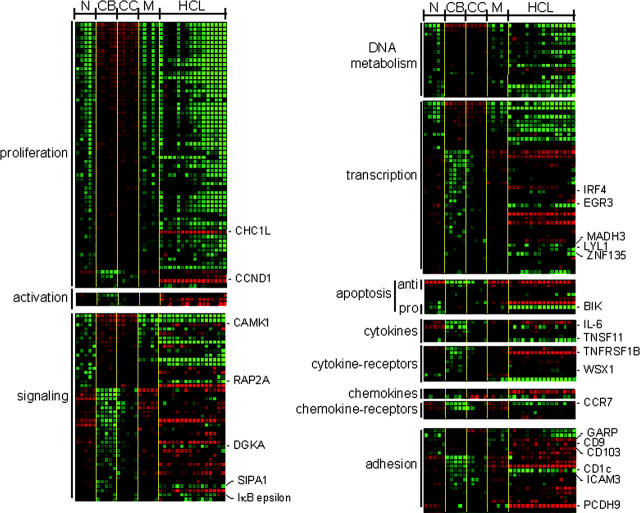
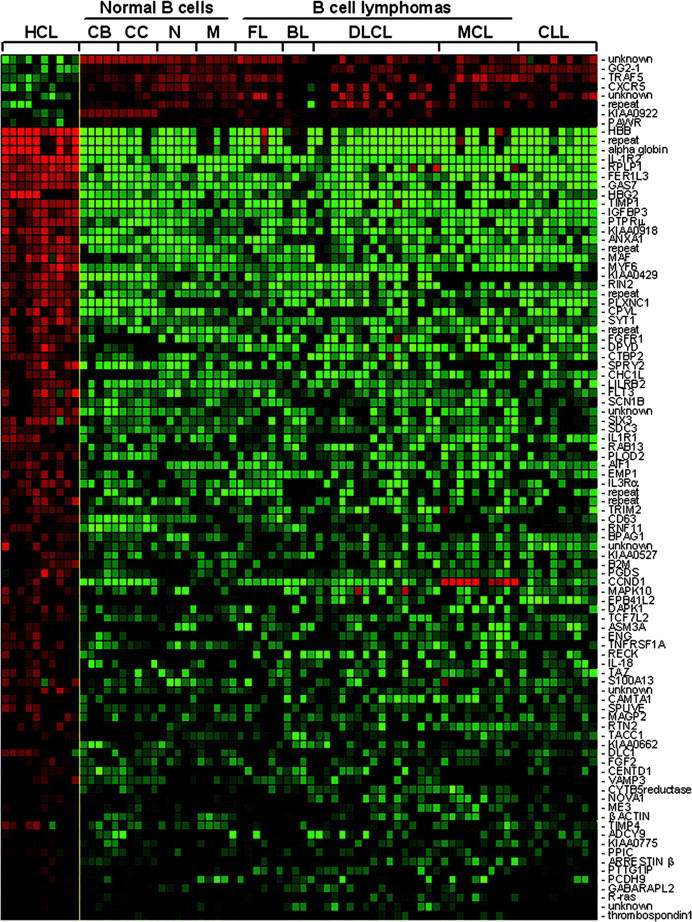
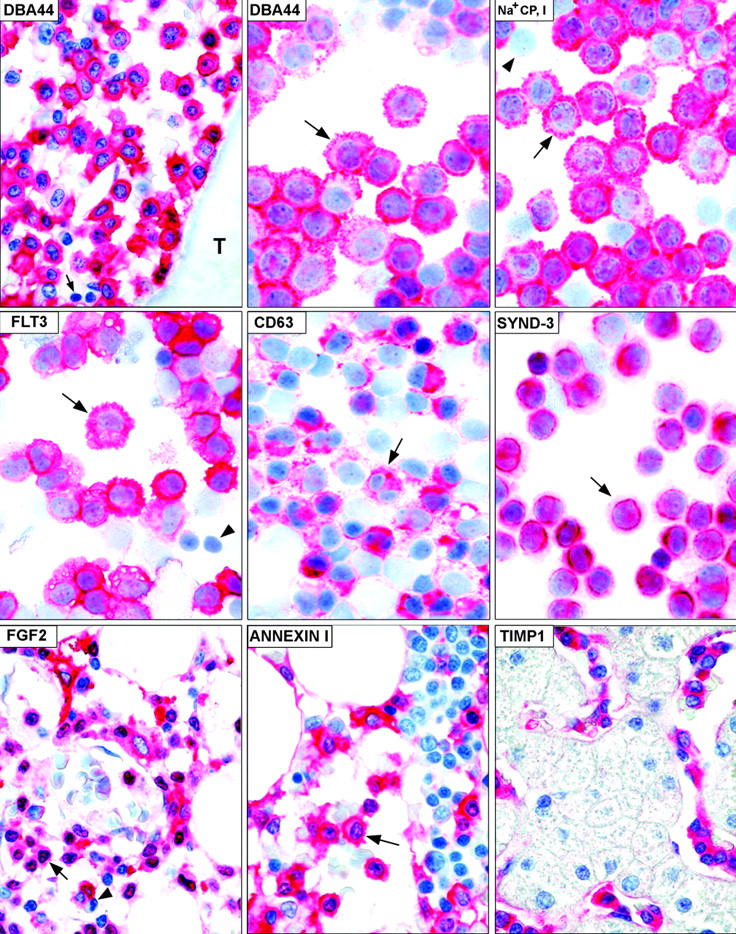
Hairy cell leukemia (HCL) is a chronic B cell malignancy characterized by the diffuse infiltration of bone marrow and spleen by cells displaying a typical "hairy" morphology. However, the nature of the HCL phenotype and its relationship to normal B cells and to other lymphoma subtypes remains unclear. Using gene expression profiling, we show here that HCL displays a homogeneous pattern of gene expression, which is clearly distinct from that of other B cell non-Hodgkin lymphomas. Comparison with the gene expression profiles of purified normal B cell subpopulations, including germinal center (GC), pre-GC (naive), and post-GC (memory) B cells, shows that HCL cells are more related to memory cells, suggesting a derivation from this B cell population. Notably, when compared with memory cells, HCL cells displayed a remarkable conservation in proliferation, apoptosis, and DNA metabolism programs, whereas they appeared significantly altered in the expression of genes controlling cell adhesion and response to chemokines. Finally, these analyses have identified several genes that are specifically expressed in HCL and whose expression was confirmed at the protein level by immunocytochemical analysis of primary HCL cases. These results have biological implications relevant to the pathogenesis of this malignancy as well as clinical implications for its diagnosis and therapy.


Figures

Figure 1.
Figure 1.
Unsupervised hierarchical clustering of gene expression profiles generated from HCL, non-Hodgkin lymphomas, and B-CLL. Unsupervised analysis was performed on 16 HCL samples obtained from 14 different patients as follows: 11 samples are BM biopsies (HCL BM biopsies) and 5 samples (HCL) are from different origins, including 3 samples of CD19+ purified cells from peripheral blood (for two of them, the BM biopsy is also depicted), 1 sample of mononucleated cells from peripheral blood, and 1 sample of spleen biopsy. The representative panel of B cell malignancies includes 6 cases of follicular lymphoma (FL), 4 cases of Burkitt lymphoma (BL), 16 cases of diffuse large B cell lymphoma (DLBCL), 10 cases of mantle cell lymphoma (MCL), and 10 cases of B cell chronic lymphocytic leukemia (B-CLL). The dendrograms are generated using a hierarchical clustering algorithm based on the average-linkage method. In the matrix, each column represents a sample and each row represents a gene. The color scale bar shows the relative gene expression changes normalized by the standard deviation (0 is the mean expression level of a given gene). (A) The 62 tumor samples (16 HCL, 6 FL, 4 BL, 16 DLBCL, 10 MCL, and 10 B-CLL) are clustered according to their expression of 382 genes. (bone marrow signature) Genes specifically associated to the BM biopsies. (B) The HCL BM biopsies are not included in this analysis. The samples are clustered according to their expression of 389 genes.
Figure 2.
Figure 2.
Relatedness of the gene expression profile of HCL to normal B cell populations, and LCLs and multiple myeloma (MM) cell lines. A supervised analysis is used to identify the genes differentially expressed between two groups of samples. (A) Naive and memory B cells (N & M) are compared with GC centroblasts and centrocytes. (B) Naive B cells are compared with memory B cells. (C) EBV-transformed LCLs, representing immunoblasts, are compared with memory B cells. (D) MM cell lines, representing transformed plasma cells, are compared with memory B cells. The expression of the selected genes is investigated in HCL represented on the right side of each matrix (A–D). The expression of specific GC (BCL6, CD38, and CD10), naive (CD23), memory B cell (CD27), and plasma cell (MUM1, CD138, and BLIMP1) markers are highlighted (A–D, bottom). The supervised analysis is performed using the Genes@Work software platform. The results of the analysis are shown in the matrices, where each row represents a gene and each column represents a sample. Genes are ranked according to the z score (mean expression difference of the gene between the phenotype group and the control group/standard deviation). The color change in each row represents the gene expression relative to the mean across the samples. Values are visualized according to the scale bar that represents the difference in the ζ score (expression difference/standard deviation) relative to the mean. (E) A cell-type classification is used to measure the relatedness of HCL to memory and naive B cells (M & N) or GC, to memory (M) or naive (N) B cells, to memory B cells or LCL cell lines, and to memory B cells and MM cell lines. The gray area marks 95% of confidence: the p-value decreases with increasing distance from the x axis.
Figure 3.
Figure 3.
Analysis in HCL of genes associated in normal B cells to the GC transitions. The genes that are differentially expressed in naive, memory, and GC B cells during the GC transit were identified by supervised analysis. The genes were classified according to functional categories. The expression of the transition genes is investigated in HCL (right, both matrices). For description of the matrix, see Fig. 2. Genes that show different expression (at least threefold) between memory B cells and HCL are indicated. For the complete list of the genes, GenBank/EMBL/DDBJ accession nos., and Affymetrix codes, see Table S3 (available at http://www.jem.org/cgi/content/full/jem.20031175/DC1).
Figure 4.
Figure 4.
Identification of HCL-specific genes. A supervised analysis is performed using 10 samples of HCL (five BM biopsies and five non-BM samples) versus the normal B cell subpopulations (CB, CC, N, and M), different types of B-NHL (FL, BL, DLBCL, and MCL), and B-CLL. The B-NHL and B-CLL tumor samples are the same as those used in the unsupervised analysis (Fig. 1). The support value for the analysis was chosen as n = no − 2 (no, number of samples in the phenotype set). The analysis identified 89 genes that are differentially expressed in HCL versus all the other samples. Gene names are indicated, and some genes appear more than once (repeat). For GenBank/EMBL/DDBJ accession nos. and Affymetrix codes, see Table S4 (available at http://www.jem.org/cgi/content/full/jem.20031175/DC1).
Figure 5.
Figure 5.
(top left, DBA44) BM biopsy from patient 5 showing massive infiltration by DBA44+ hairy cells; the arrow indicates rare residual hemopoietic precursors. (T) A bone trabecula (APAAP; 800×). (top middle, DBA44) Cytocentrifuge preparation (patient 3) showing strong surface positivity of HCL cells for DBA44 (arrow, APAAP; 800×). (Na+ CP, I) Cytospin (patient 3). Positivity for Na+ channel, type I, is mainly seen on the surface membrane (arrow). A negative lymphoid cell (arrowhead, APAAP; 800×). (FLT3) Cytospin (patient 3). Labeling of leukemic cells for FLT3 is mainly seen on the cell surface (arrow). A negative normal residual lymphocyte (arrowhead, APAAP; 800×). (CD63 and SYND-3) Cytospins (patient 3). Expression of CD63 and Syndecan-3 expression are mainly cytoplasmic (arrow, microgranular) and perinuclear (arrow), respectively (APAAP; 800×). (FGF2) BM biopsy (paraffin section) from patient 4. HCL cells show strong nuclear and cytoplasmic positivity for FGF2 (arrow, bFGF), whereas residual hemopoietic precursors are negative (arrowhead, APAAP; 800×). (Annexin I) BM biopsy (patient 4). Leukemic cells are strongly positive for annexin I (arrow). Positivity is mainly seen in the cytoplasm and surface, whereas nuclei are negative or faintly positive. An island of annexin 1–negative residual erythroid precursors is shown (APAAP; 800×). (TIMP1) Liver biopsy (paraffin section) from patient 3 showing typical infiltration of hepatic sinusoids by TIMP1+ leukemic hairy cells (APAAP; 800×).

References

    1. Burke, J.S. 1978. The value of the bone-marrow biopsy in the diagnosis of hairy cell leukemia. Am. J. Clin. Pathol. 70:876–884. - PubMed
    1. Brunning, M., and R.W. McKenna. 1994. Atlas of Tumor Pathology: Tumors of the Bone Marrow. Armed Forces Institute of Pathology. Washington, D.C.: Universities Associated for Research and Education in Pathology.
    1. Harris, N.L., E.S. Jaffe, H. Stein, P.M. Banks, J.K. Chan, M.L. Cleary, G. Delsol, C. De Wolf-Peeters, B. Falini, and K.C. Gatter. 1994. A revised European-American classification of lymphoid neoplasms: a proposal from the International Lymphoma Study Group. Blood. 84:1361–1392. - PubMed
    1. Jaffe, E.S., N.L. Harris, H. Stein, and J.W. Vardiman. 2001. World Health Organization Classification of Tumours: Pathology and Genetics of Tumours of Haematopoietic and Lymphoid Tissues. IARC Press, Lyon, France. 351 pp.
    1. Mey, U., J. Strehl, M. Gorschluter, C. Ziske, A. Glasmacher, H. Pralle, and I. Schmidt-Wolf. 2003. Advances in the treatment of hairy-cell leukaemia. Lancet. Oncol. 4:86–94. - PubMed

Publication types

MeSH terms