Comparative Study
. 2004 Jan;14(1):11-7.
doi: 10.1101/gr.1712904.

Bichir HoxA cluster sequence reveals surprising trends in ray-finned fish genomic evolution

Affiliations
Comparative Study

Bichir HoxA cluster sequence reveals surprising trends in ray-finned fish genomic evolution

Chi-Hua Chiu et al. Genome Res. 2004 Jan.

Abstract

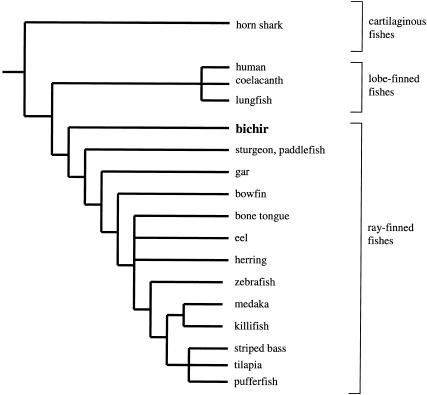
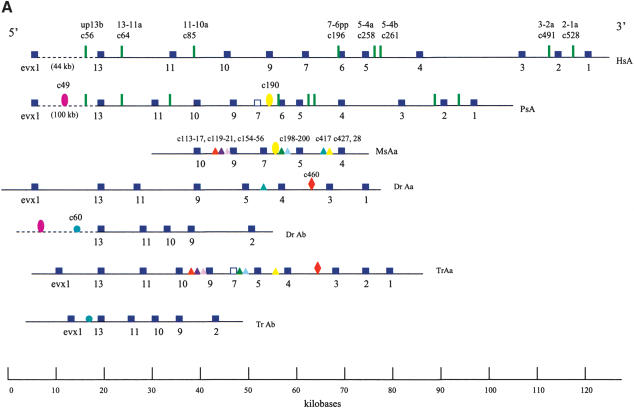
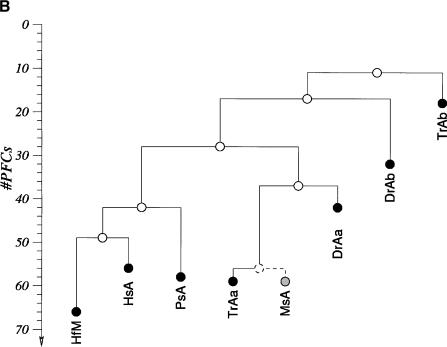
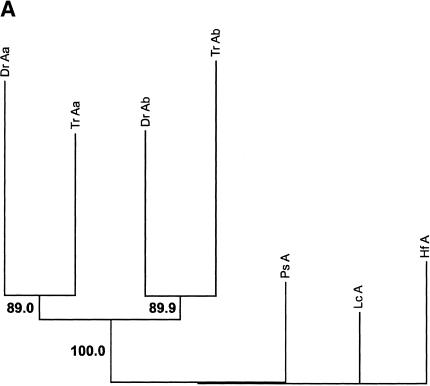
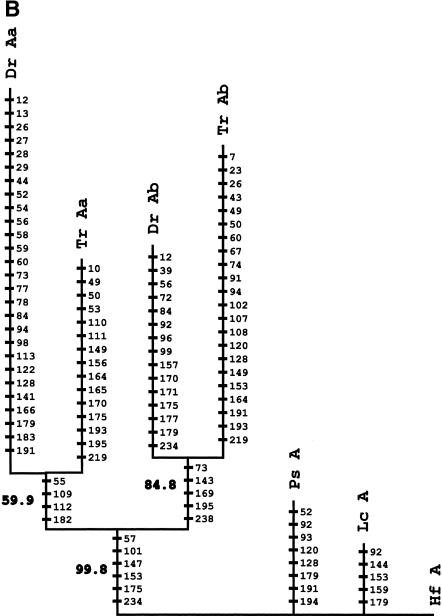
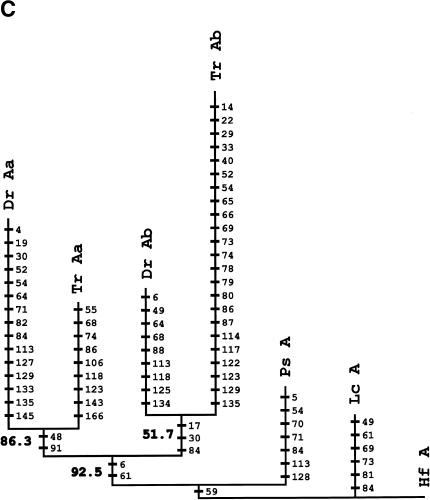
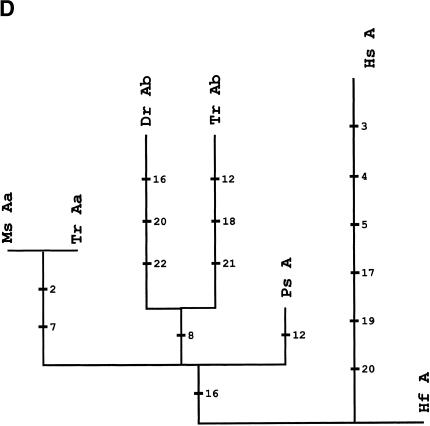
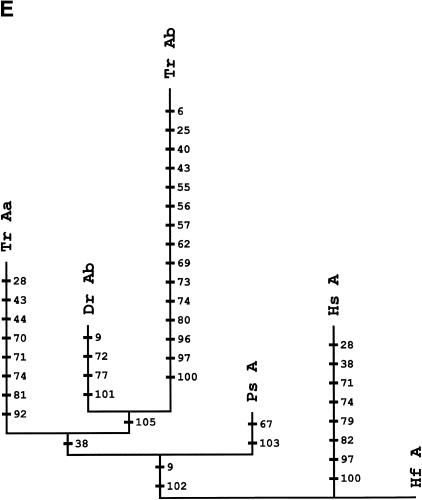
The study of Hox clusters and genes provides insights into the evolution of genomic regulation of development. Derived ray-finned fishes (Actinopterygii, Teleostei) such as zebrafish and pufferfish possess duplicated Hox clusters that have undergone considerable sequence evolution. Whether these changes are associated with the duplication(s) that produced extra Hox clusters is unresolved because comparison with basal lineages is unavailable. We sequenced and analyzed the HoxA cluster of the bichir (Polypterus senegalus), a phylogenetically basal actinopterygian. Independent lines of evidence indicate that bichir has one HoxA cluster that is mosaic in its patterns of noncoding sequence conservation and gene retention relative to the HoxA clusters of human and shark, and the HoxAalpha and HoxAbeta clusters of zebrafish, pufferfish, and striped bass. HoxA cluster noncoding sequences conserved between bichir and euteleosts indicate that novel cis-sequences were acquired in the stem actinopterygians and maintained after cluster duplication. Hence, in the earliest actinopterygians, evolution of the single HoxA cluster was already more dynamic than in human and shark. This tendency peaked among teleosts after HoxA cluster duplication.


Figures

Figure 1
Figure 1
Overview of jawed-vertebrate phylogenetic relationships with focus on the ray-finned fishes (Actinopterygii; Patterson 1982; Nelson 1994; Bartsch and Britz 1997; Bemis et al. 1997). The other two living sister groups to the ray-finnedfishes among gnathostomes are the cartilaginous (Chondrichthyes) andlobe-finned(Sarcopterygii) fishes, respectively. Note that only some euteleost clades are well represented to date, but remaining higher actinopterygian groups, Chondrostei (sturgeon and paddlefish), Neopterygii (gar, bowfin, and teleosts), andbasal teleost clades are virtually unresolved. This general outline of actinopterygian phylogeny is supportedin three of the most recent hypotheses basedon molecular data (Le et al. 1993; Venkatesh et al. 2001; Inoue et al. 2003). But, as with some conflicting morphologically basedhypotheses in the past, these also still indicate changing positions or lack of resolution among other basal actinopterygian fauna: sturgeon and paddlefish, gar, and bowfin.
Figure 2
Figure 2
HoxA clusters and PFCs in human, shark, bichir, andeuteleosts. (Hs) Homo sapiens; (Hf) Heterodontus francisci; (Ps) Polypterus senegalus; (MsAa) Morone saxatilis HoxAα; (DrAa) Danio rerio HoxAα; (DrAb) D. rerio HoxAβ; (TrAa) Takifugu rubripes HoxAα; (TrAb) T. rubripes HoxAβ. (A) Hox genes are indicatedby blue rectangles. PFCs sharedexclusively between human andbichir are indicatedby green bars. PFCs sharedexclusively between bichir andeuteleosts are indicatedby coloredellipses. PFCs sharedbetween the HoxAα clusters of striped bass, zebrafish, and/or pufferfish are indicated by coloredtriangles. The PFC sharedbetween only zebrafish andpufferfish HoxAα clusters is indicated by a red diamond. The PFC shared between zebrafish andpufferfish HoxAβ clusters is indicated by an aqua blue circle. See text for description. (B) The co-occurrences of the PFCs in different clusters (Supplemental Table 1) can be representedas a tree. The height of an internal node is the average number of PFCs shared by two clusters in the two different subtrees. The position of the tips gives the total number of PFCs in the segment of the HoxA cluster that spans from Evx1 to HoxA1. The nonduplicated HoxA regions of human, shark, andbichir form one group. The secondsignificant group consists of the HoxAα sequences of the euteleosts. The position of the incomplete stripedbass (Morone saxatilis) sequence is estimatedby assuming that in a complete sequence we wouldhave foundroughly the same number of PFCs as in pufferfish (T. rubripes). The HoxAβ clusters are much further divergedanddo not appear to group together because euteleost-specific PFCs in the HoxAβ cluster are very rare (Supplemental Table 1). The smaller rate of PFC loss in the zebrafish HoxAβ cluster is the dominating effect.
Figure 2
Figure 2
HoxA clusters and PFCs in human, shark, bichir, andeuteleosts. (Hs) Homo sapiens; (Hf) Heterodontus francisci; (Ps) Polypterus senegalus; (MsAa) Morone saxatilis HoxAα; (DrAa) Danio rerio HoxAα; (DrAb) D. rerio HoxAβ; (TrAa) Takifugu rubripes HoxAα; (TrAb) T. rubripes HoxAβ. (A) Hox genes are indicatedby blue rectangles. PFCs sharedexclusively between human andbichir are indicatedby green bars. PFCs sharedexclusively between bichir andeuteleosts are indicatedby coloredellipses. PFCs sharedbetween the HoxAα clusters of striped bass, zebrafish, and/or pufferfish are indicated by coloredtriangles. The PFC sharedbetween only zebrafish andpufferfish HoxAα clusters is indicated by a red diamond. The PFC shared between zebrafish andpufferfish HoxAβ clusters is indicated by an aqua blue circle. See text for description. (B) The co-occurrences of the PFCs in different clusters (Supplemental Table 1) can be representedas a tree. The height of an internal node is the average number of PFCs shared by two clusters in the two different subtrees. The position of the tips gives the total number of PFCs in the segment of the HoxA cluster that spans from Evx1 to HoxA1. The nonduplicated HoxA regions of human, shark, andbichir form one group. The secondsignificant group consists of the HoxAα sequences of the euteleosts. The position of the incomplete stripedbass (Morone saxatilis) sequence is estimatedby assuming that in a complete sequence we wouldhave foundroughly the same number of PFCs as in pufferfish (T. rubripes). The HoxAβ clusters are much further divergedanddo not appear to group together because euteleost-specific PFCs in the HoxAβ cluster are very rare (Supplemental Table 1). The smaller rate of PFC loss in the zebrafish HoxAβ cluster is the dominating effect.
Figure 3
Figure 3
Phylogenetic analysis andcharacter reconstructions of Hox coding sequences. (A) Neighbor-joining tree of concatenated HoxA13 and HoxA11 exon 1 coding sequences. Bootstrap support (1000 replications) for the euteleost nodes are shown. (Hf) Heterodontus francisci; (Lc) Latimeria chalumnae; (Ps) Polypterus senegalus; (TrAb) Takifugu rubripes HoxAβ; (DrAb) Danio rerio HoxAβ; (TrAa) T. rubripes HoxAα; (DrAa) D. rerio HoxAα. (B-E) Character reconstructions of exon 1 coding sequences under constraint trees for HoxA13, HoxA11, HoxA10, and HoxA2, respectively. Taxa abbreviations are as in A above, including (Hs) Homo sapiens. The indicated substitutions are only those that map unambiguously to the branches of the trees. The numbers of analyzedamino acidresidues andassumedunambiguous changes for each gene are (B) HoxA13, 244 amino acids and 196 steps; (C) HoxA11, 192 amino acids and 151 steps; (D) HoxA10, 24 amino acids and 35 steps; (E) HoxA2, 105 amino acids and 59 steps.
Figure 3
Figure 3
Phylogenetic analysis andcharacter reconstructions of Hox coding sequences. (A) Neighbor-joining tree of concatenated HoxA13 and HoxA11 exon 1 coding sequences. Bootstrap support (1000 replications) for the euteleost nodes are shown. (Hf) Heterodontus francisci; (Lc) Latimeria chalumnae; (Ps) Polypterus senegalus; (TrAb) Takifugu rubripes HoxAβ; (DrAb) Danio rerio HoxAβ; (TrAa) T. rubripes HoxAα; (DrAa) D. rerio HoxAα. (B-E) Character reconstructions of exon 1 coding sequences under constraint trees for HoxA13, HoxA11, HoxA10, and HoxA2, respectively. Taxa abbreviations are as in A above, including (Hs) Homo sapiens. The indicated substitutions are only those that map unambiguously to the branches of the trees. The numbers of analyzedamino acidresidues andassumedunambiguous changes for each gene are (B) HoxA13, 244 amino acids and 196 steps; (C) HoxA11, 192 amino acids and 151 steps; (D) HoxA10, 24 amino acids and 35 steps; (E) HoxA2, 105 amino acids and 59 steps.

Similar articles

Cited by

References

    1. Altschul, S.F., Gish, W., Miller, W., Myers, E.W., and Lipman, D.J. 1990. Basic local alignment search tool. J. Mol. Biol. 215: 403-410. - PubMed
    1. Amores, A., Force, A., Yan, Y.-L., Jolly, L., Amemiya, C.T., Fritz, A., Ho, R.K., Langeland, J., Prince, V., Wang, Y.L., et al. 1998. Zebrafish hox clusters and vertebrate genome evolution. Science 282: 1711-1714. - PubMed
    1. Amores, A., Suzuki, T., Yan, Y-L., Pomeroy, J., Singer, A., Amemiya, C.T., and Postlethwait, J.H. 2003. Developmental roles of pufferfish Hox clusters and genome evolution in ray-fin fish. Genome Res. (this issue). - PMC - PubMed
    1. Aparicio, S., Chapman, J., Stupka, E., Putnam, N., Chia, J.M., Dehal, P., Christoffels, A., Rash, S., Hoon, S., Smit, A., et al. 2002. Whole-genome shotgun assembly and analysis of the genome of Fugu rubripes. Science 297: 1301-1310. - PubMed
    1. Bartsch, P. and Britz, R. 1997. A single micropyle in the eggs of the most basal living actinopterygian fish, Polypterus (Actinopterygii, Polypteriformes). J. Zool. London 241: 589-592.

WEB SITE REFERENCES

    1. http://www.rzpd.de; RZPD.

Publication types

LinkOut - more resources