. 2004 Jan 5;164(1):97-109.
doi: 10.1083/jcb.200309160.

Oriented clonal cell growth in the developing mouse myocardium underlies cardiac morphogenesis

Affiliations

Oriented clonal cell growth in the developing mouse myocardium underlies cardiac morphogenesis

Sigolène M Meilhac et al. J Cell Biol. .

Abstract

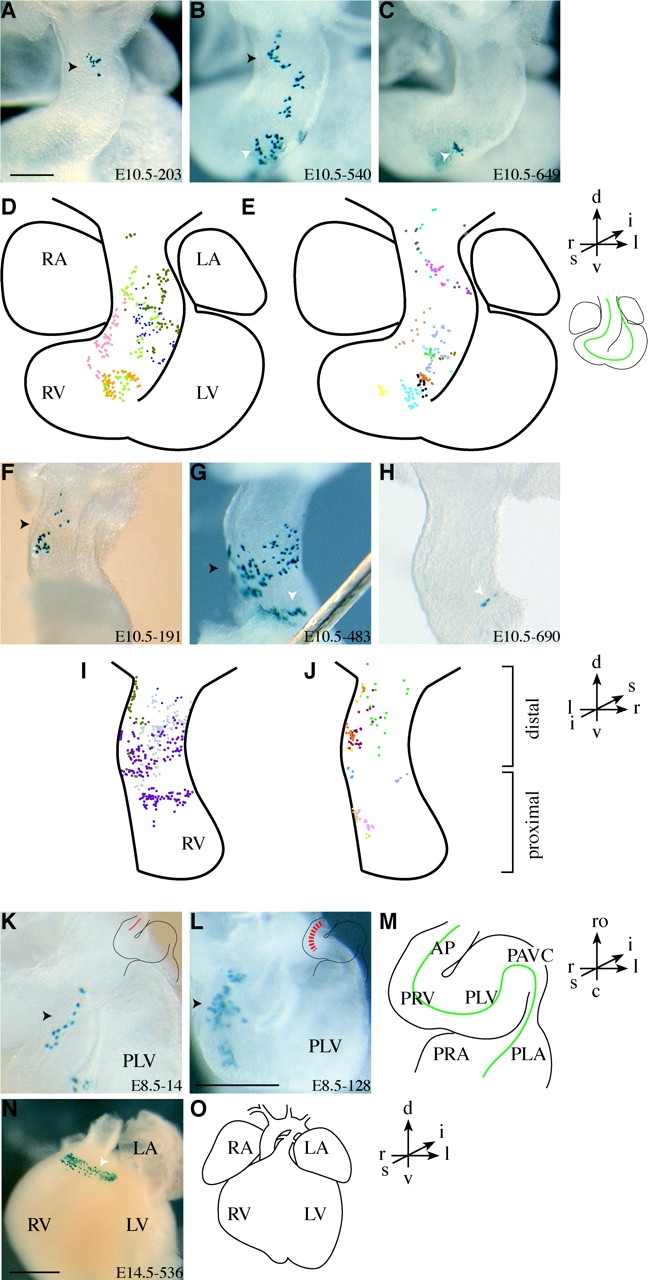
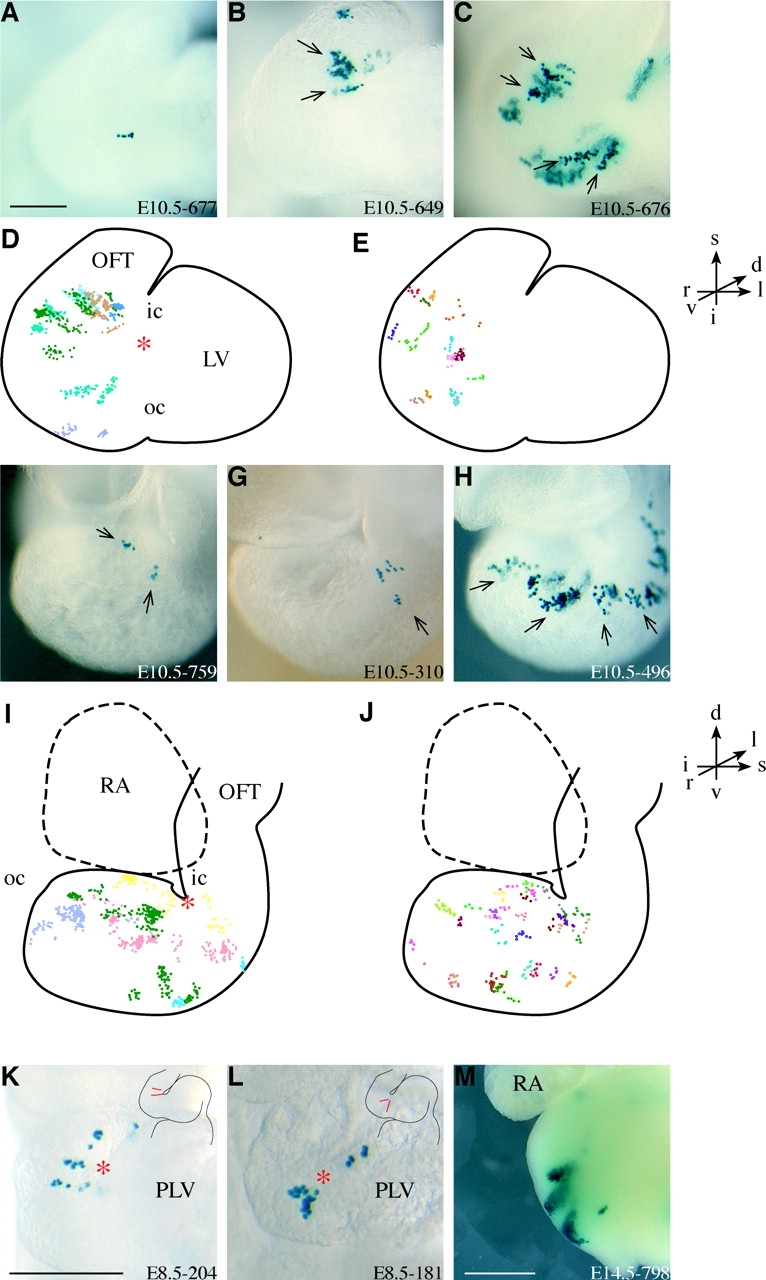
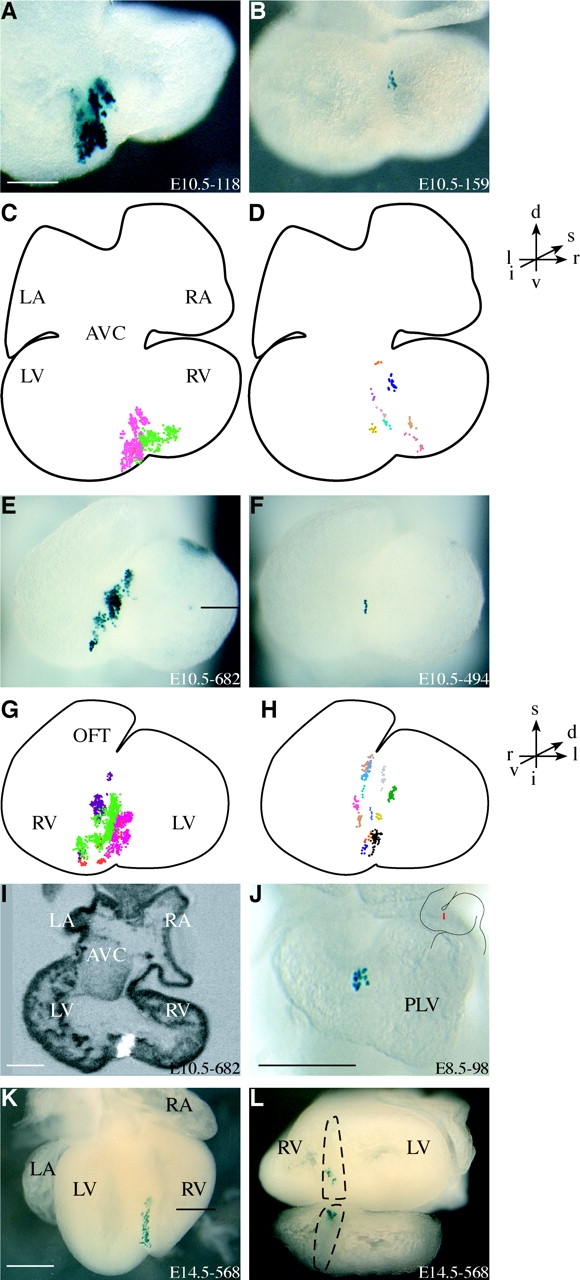
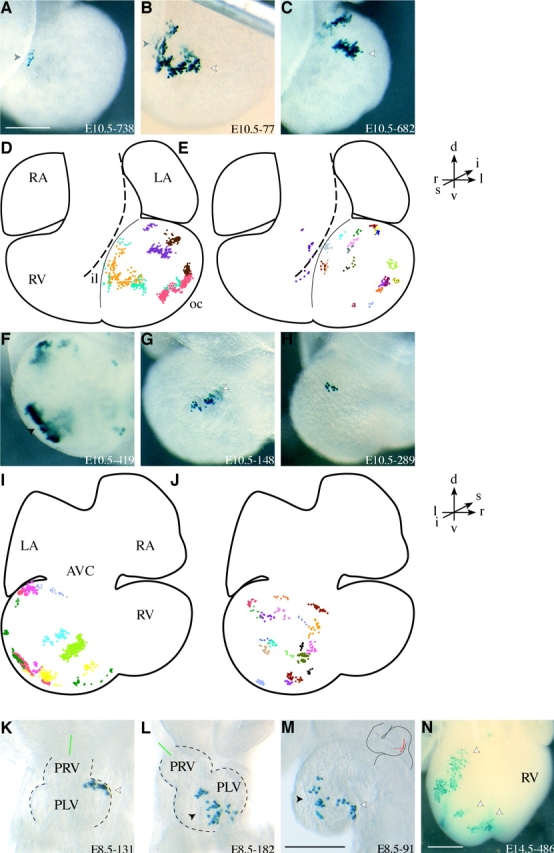
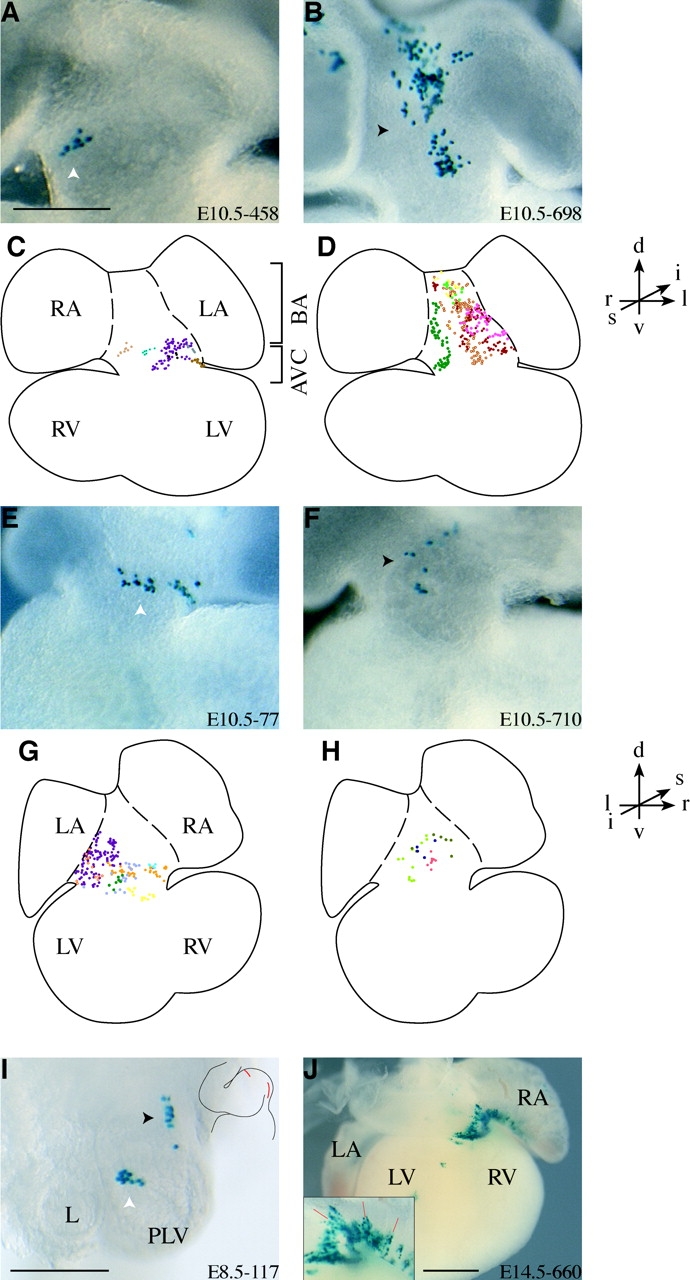
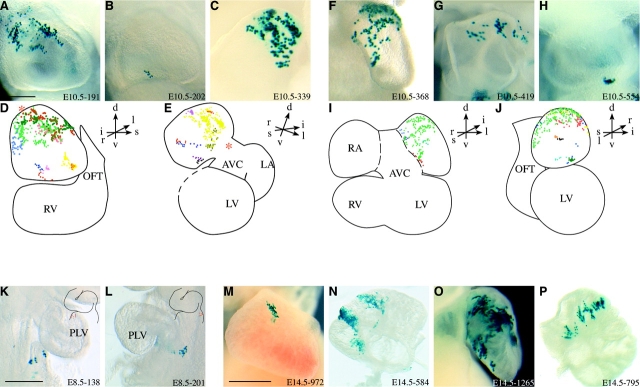
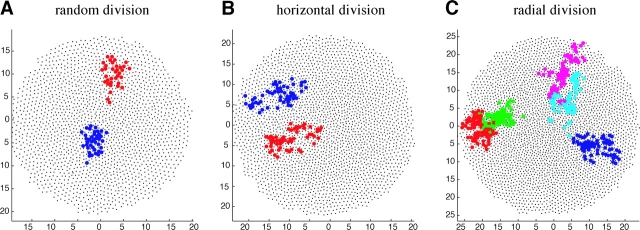
During heart morphogenesis, cardiac chambers arise by differential expansion of regions of the primitive cardiac tube. This process is under the control of specific transcription factors such as Tbx5 and dHAND. To gain insight into the cellular mechanisms that underlie cardiogenesis, we have used a retrospective clonal approach based on the spontaneous recombination of an nlaacZ reporter gene targeted to the murine alpha-cardiac actin locus. We show that clonal growth of myocardial cells is oriented. At embryonic day (E) 10.5, the shape of clones is characteristic of a given cardiac region and reflects its morphology. This is already detectable in the primitive cardiac tube at E8.5, and is maintained after septation at E14.5 with additional modulations. The clonal analysis reveals new subdivisions of the myocardium, including an interventricular boundary region. Our results show that the myocardium, from the time of its formation, is a polarized and regionalized tissue and point to the role of oriented clonal cell growth in cardiac chamber morphogenesis.


Figures

Figure 1.
Figure 1.
Clusters of β-galactosidase–positive cells in the outflow tract. Examples of staining in the outflow tract, viewed superiorly (A–C) and inferiorly (F–H) at E10.5, with a low (A, C, F, and H) or high (B and G) number of β-galactosidase–positive cells. Schematic representations of an E10.5 heart in a superior view (D and E) and of an E10.5 outflow tract in an inferior view (I and J), showing the large (n ≥ 40 cells in D and I) and small (5 ≤ n ≤ 40 in E and J) clones that were observed in the outflow tract, each in a distinct color. The arterial–venous axis is indicated in green opposite E, and the potential limit between proximal and distal outflow tract opposite J. Examples of large clones in the anterior extremity of the looping cardiac tube at E8.5, in the superior (K) and inferior (L) aspects of the tube (superior views, with labeled cells in L visualized through the tissue). The orientation of clones (in red) is schematized in the insets. (M) Schematic representation of an E8.5 looped heart tube from a ventral view, showing the presumptive regions where clones with distinct properties are detected. The arterial–venous axis is represented in green. (N) An example of a large clone in the outlet of the right ventricle at E14.5 (superior view). (O) Schematic representation of an E14.5 heart from a superior view. Arrowheads indicate a preferential orientation of β-galactosidase–positive cells, which is parallel (black) or perpendicular (white) to the arterial–venous axis. In Figs. 1–6, the numbers in the bottom right corner of the panels indicate the stage followed by the identification number of the positive embryos. AP, arterial pole; AVC, atrioventricular canal; ic, inner curvature; LA, left atrium; LV, left ventricle; oc, outer curvature; OFT, outflow tract; PAVC, presumptive atrioventricular canal; PLA, primitive left atrium; PLV, primitive left ventricle; PRA, primitive right atrium; PRV, presumptive right ventricle; RA, right atrium; RV, right ventricle. The nomenclature superior/inferior is used rather than ventral/dorsal or cranial/caudal, which is confusing because of the looping of the cardiac tube relative to the embryo (see Materials and methods). c, caudal; d, dorsal; i, inferior; l, left; r, right; ro, rostral; s, superior; v, ventral. Bars, 500 μm here and in all other figures.
Figure 2.
Figure 2.
Clusters of β-galactosidase–positive cells in the right ventricle. Examples of staining in the embryonic right ventricle at E10.5, in ventral (A–C) and right lateral (F–H) views, with a low (A, F, and G) or high (B, C, and H) number of cells. Arrows indicate the circumferential orientation of β-galactosidase–positive clusters. Schematic representations of an E10.5 heart in the same views (D and E; I and J, respectively), showing the large (D and I) and small (E and J) clones that were observed in the right ventricle, each in a distinct color. Asterisks indicate the points of convergence of the oriented clusters. Examples of large clones in the superior part of the presumptive right ventricular region of the cardiac tube, adjacent to the primitive left ventricle, at E8.5 (K and L, superior views). The orientation of clones (in red) is schematized in the inset. (M) An example of a large clone in the right ventricle at E14.5 (superior view).
Figure 3.
Figure 3.
Clusters of β-galactosidase–positive cells in the interventricular region. Examples of staining in the interventricular region at E10.5 in inferior (A and B) and ventral (E and F) views, with a high (A and E) or low (B and F) number of cells. Schematic representations of an E10.5 heart in the same views (C and D; G and H, respectively), showing the large (C and G) and small (D and H) clones that were observed in the interventricular region, each in a distinct color. (I) Transverse section of the heart in E, visualized by optical projection tomography at the level indicated by a black bar, showing labeled cells (in white) in the inner primordium of the interventricular septum. (J) An example of a clone at the limit of the primitive left ventricle at E8.5 (superior view). The orientation of the clone (in red) is schematized in the inset. (K) An example of a clone at the level of the interventricular septum at E14.5 (inferior view). (L) Both sides of the transversally sectioned heart in K at the level indicated by a black bar, showing labeled cells in the interventricular septum (within dotted lines).
Figure 4.
Figure 4.
Clusters of β-galactosidase–positive cells in the left ventricle. Examples of staining in the embryonic left ventricle at E10.5 in a superior (A–C) and inferior (F–H) view, with a low (A and H) or high (B, C, F, and G) number of cells. Schematic representations of an E10.5 heart in the same views (D and E; I and J, respectively), showing the large (D and I) and small (E and J) clones that were observed in the embryonic left ventricle, each in a distinct color. The dotted contour in D and E represents the limit of the outflow tract; however, only β-galactosidase–positive cells, which are behind the outflow tract, are shown. The inner limit (il) of the left ventricular bulge is represented by a thin line. (K–M) Examples of large clones in the primitive left ventricle of the linear (K, superior view, stage 6 somites), early looped (L, superior view, stage 8 somites), and later looped (M, left lateral view, stage 12 somites) heart tube. The green lines in K and L point to the direction of the arterial–venous axis. The inset in M schematizes the orientation of the clusters (in red). (M) An example of a large clone in the left ventricle at E14.5 (inferior view). Arrowheads indicate a preferential orientation of β-galactosidase–positive cells at the inner limit of the bulging left ventricle (gray), along its outer curvature (black) and perpendicularly (white).
Figure 5.
Figure 5.
Clusters of β-galactosidase–positive cells in the atrioventricular canal and the body of the atrium. Examples of staining at E10.5 in superior (A and B) and inferior (E and F) views, with a low (A and F) or high (B and E) number of cells. Schematic representations of an E10.5 heart in the same views (C and D; G and H, respectively), showing the clones (n ≥ 5 cells), each in a distinct color, that were observed in the atrioventricular canal (C and G) and in the body of the atrium (D and H). The potential limit between the atrioventricular canal (AVC) and the body of the atrium (BA) is indicated between C and D. Note the continuity of the clone represented in violet in the superior (C) and inferior (G) views. The dotted contour underlines the limit of the atrial appendages, which are not considered in this figure (see Fig. 6). In A–D, the outflow tract has been removed for direct visualization of labeled cells. (I) An example of a clone at the venous pole, between the primitive left ventricle and the sinus venosus, at E8.5 (rostral view). The orientation of clones (in red) is schematized in the inset. L, lumen of the arterial pole. (J) An example of a clone in the inlet of the right ventricle and in the smooth-walled lower rim of the atrium at E14.5 (inferior view). Inset in J shows a close-up of the clone, with the orientation of secondary rows of cells indicated by red bars. Arrowheads indicate a preferential orientation of β-galactosidase–positive cells, which is parallel (black) or perpendicular (white) to the arterial–venous axis.
Figure 6.
Figure 6.
Clusters of β-galactosidase–positive cells in the atrial appendages. (A–E, K, M, and N) Right atrium. Examples of staining in the right atrial appendage at E10.5 in right lateral (A and B) and ventral (C) views, with a high (A and C) or low (B) number of cells. Schematic representations of an E10.5 heart in the same views (D and E, respectively), showing the clones (n ≥ 5 cells) that were observed in the right atrial appendage, each in a distinct color. The dotted contour in E represents the site of section of the embryonic right ventricle and outflow tract that was removed to permit a direct visualization of the ventral side of the right atrial appendage. Asterisks indicate the point of convergence of the oriented clusters. (K) An example of a clone in the primitive right atrium at E8.5 (right lateral view). The orientation of the clone (in red) is schematized in the inset. (M and N) Examples of clones in the right atrium at E14.5 (M, lateral view; N, ventral view). (F–J, L, O, and P) Left atrium. Examples of staining in the left atrial appendage at E10.5 in superior (F) and left lateral (G and H) views, with a high (F and G) or low (H) number of cells. Schematic representations of an E10.5 heart in the same views (I and J, respectively), showing the clones that were observed in the left atrial appendage, each in a distinct color. The dotted contour in I indicates the limit of the atrial appendages. (L) An example of a clone in the primitive left atrium at E8.5 (left lateral view). The orientation of the clone (in red) is schematized in the inset. (O and P) Examples of clones in the left atrium at E14.5 (O, superior view; P, ventral view).
Figure 7.
Figure 7.
Modeling of myocardial cell growth. Cells are represented by dots and are assumed to divide with a constant rate. They undergo random rearrangements after division to maintain their relative distance constant. The position of daughter cells is oriented either randomly (A), horizontally (B), or radially (C). Clones of cells are labeled, each in a distinct color.
Figure 8.
Figure 8.
Orientation of clonal growth in the embryonic heart. (A and B) Schematic representations of an E10.5 heart in a superior view, showing a summary of the orientation of clonal growth presented in this paper. Continuous lines indicate clonal growth in a superior view and dotted lines in an inferior view. For clarity, data in the outflow tract (OFT), embryonic right ventricle (RV), and embryonic left ventricle (LV) are illustrated in A, and in the interventricular region (IV), atrioventricular canal (AVC), body of the atrium (BA), and atrial appendages (LA, RA) in B, in which the outflow tract has been removed. Based on the shape of clusters of clonally related cells, three patterns of clonal growth are distinguished. Clonal growth has a preferential axial orientation along the arterial–venous axis (in blue) in the distal outflow tract and in the body of the atrium. Note the spiralling of the axis in the outflow tract. Clonal growth is circumferential (in green) in the proximal outflow tract, embryonic right ventricle, interventricular region, and atrioventricular canal. In the embryonic left ventricle and the atrial appendages, which bud out from the tube, clonal growth has a more complex orientation (in red): arching over the circumference in the left atrium, lying radially in the right atrium, and showing two perpendicular orientations in the left ventricle. d, dorsal; i, inferior; l, left; r, right; s, superior; v, ventral. (C) Regionalization of the orientation of clonal growth within a given region. Cell behavior is distinct (gray/white) between the inferior/superior aspects of the outflow tract and between the dorsal/ventral right ventricle as well as between the right and left atria, and it is discontinuous in the inferior/superior parts of the left ventricle.

Similar articles

Cited by

References

    1. Bonnerot, C., and J.F. Nicolas. 1993. Clonal analysis in the intact mouse embryo by intragenic homologous recombination. C. R. Acad. Sci. III. 316:1207–1217. - PubMed
    1. Bruneau, B., M. Logan, N. Davis, T. Levi, C. Tabin, J. Seidman, and C. Seidman. 1999. Chamber-specific cardiac expression of Tbx5 and heart defects in Holt-Oram syndrome. Dev. Biol. 211:100–108. - PubMed
    1. Campione, M., M.A. Ros, J.M. Icardo, E. Piedra, V.M. Christoffels, A. Schweickert, M. Blum, D. Franco, and A.F. Moorman. 2001. Pitx2 expression defines a left cardiac lineage of cells: evidence for atrial and ventricular molecular isomerism in the iv/iv mice. Dev. Biol. 231:252–264. - PubMed
    1. Chen, F., H. Kook, R. Milewski, A. Gitler, M. Lu, J. Li, R. Nazarian, R. Schnepp, K. Jen, C. Biben, et al. 2002. Hop is an unusual homeobox gene that modulates cardiac development. Cell. 110:713–723. - PubMed
    1. Chen, T.H., T.C. Chang, J.O. Kang, B. Choudhary, T. Makita, C.M. Tran, J.B. Burch, H. Eid, and H.M. Sucov. 2002. Epicardial induction of fetal cardiomyocyte proliferation via a retinoic acid-inducible trophic factor. Dev. Biol. 250:198–207. - PubMed

Publication types

MeSH terms