. 2004 Jan 5;164(1):145-55.
doi: 10.1083/jcb.200306112.

Microdomains of the C-type lectin DC-SIGN are portals for virus entry into dendritic cells

Affiliations

Microdomains of the C-type lectin DC-SIGN are portals for virus entry into dendritic cells

Alessandra Cambi et al. J Cell Biol. .

Abstract

The C-type lectin dendritic cell (DC)-specific intercellular adhesion molecule grabbing non-integrin (DC-SIGN; CD209) facilitates binding and internalization of several viruses, including HIV-1, on DCs, but the underlying mechanism for being such an efficient phagocytic pathogen-recognition receptor is poorly understood. By high resolution electron microscopy, we demonstrate a direct relation between DC-SIGN function as viral receptor and its microlocalization on the plasma membrane. During development of human monocyte-derived DCs, DC-SIGN becomes organized in well-defined microdomains, with an average diameter of 200 nm. Biochemical experiments and confocal microscopy indicate that DC-SIGN microdomains reside within lipid rafts. Finally, we show that the organization of DC-SIGN in microdomains on the plasma membrane is important for binding and internalization of virus particles, suggesting that these multimolecular assemblies of DC-SIGN act as a docking site for pathogens like HIV-1 to invade the host.


Figures

Figure 1.
Figure 1.
DC-SIGN is organized in microdomains on the cell surface of K-DC-SIGN. (A) The expression levels of DC-SIGN on untransfected K562 and on K-DC-SIGN were assessed by FACS® analysis. The open histogram represents the isotype control, and shaded histogram indicates the specific staining with anti–DC-SIGN (AZN-D1). (B) DC-SIGN expressed by K562 transfectants strongly binds to ICAM-3 and gp120. The adhesion was determined using 1-μm ligand-coated fluorescent beads. Specificity was determined by measuring binding in presence of AZN-D1. No blocking was observed in presence of isotype control (not depicted). Blocking exerted by EGTA indicates that DC-SIGN binds to the ligands in a Ca2+-dependent manner. The average of five independent experiments is shown (P < 0.001). (C) K-DC-SIGN cells were specifically labeled with 10-nm gold particles, as described in Materials and methods. Cells were allowed to adhere onto poly-l-lysine–coated formvar film and photographed in an electron microscope. Gold particles were detected on the periphery on the thinner less electron dense parts of cells, where good contrast could be achieved. One representative picture is shown. Bar, 200 nm.
Figure 2.
Figure 2.
DC-SIGN colocalizes with lipid rafts on K-DC-SIGN. (A) To investigate the effect of cholesterol depletion on DC-SIGN–mediated adhesion, K-DC-SIGN cells were incubated in serum-free medium with or without 20 mM MCD for 30 min at 37°C. Subsequently, gp120-coated fluorescent beads (1-μm diam) were added and the mixture was incubated for an additional 30 min at 37°C. Binding was measured by flow cytometry. After MCD treatment, cell viability was assessed by trypan blue staining. The values represent the mean of three independent experiments ±SD. (B) K-DC-SIGN were solubilized with 1% Triton X-100, subjected to sucrose gradient centrifugation and analyzed by Western blotting for the indicated molecules. The numbers indicate the gradient fractions. Fractions 9 and 10 are low density fractions containing DRM and are referred to as raft fractions. (C) Confocal microscopy analysis of copatching of DC-SIGN and GM1. K-DC-SIGN cells were stained at 4°C with 10 μg/ml anti–DC-SIGN (or anti-CD55 or anti-CD46) and 10 μg/ml FITC-CTxB. Co-patching was induced by adding secondary Ab (Materials and methods), and, after fixation in PFA, cells were analyzed by confocal microscopy. Merged images are shown in the right panel. Results are representatives of multiple cells in three independent experiments. Bar, 5 μm.
Figure 2.
Figure 2.
DC-SIGN colocalizes with lipid rafts on K-DC-SIGN. (A) To investigate the effect of cholesterol depletion on DC-SIGN–mediated adhesion, K-DC-SIGN cells were incubated in serum-free medium with or without 20 mM MCD for 30 min at 37°C. Subsequently, gp120-coated fluorescent beads (1-μm diam) were added and the mixture was incubated for an additional 30 min at 37°C. Binding was measured by flow cytometry. After MCD treatment, cell viability was assessed by trypan blue staining. The values represent the mean of three independent experiments ±SD. (B) K-DC-SIGN were solubilized with 1% Triton X-100, subjected to sucrose gradient centrifugation and analyzed by Western blotting for the indicated molecules. The numbers indicate the gradient fractions. Fractions 9 and 10 are low density fractions containing DRM and are referred to as raft fractions. (C) Confocal microscopy analysis of copatching of DC-SIGN and GM1. K-DC-SIGN cells were stained at 4°C with 10 μg/ml anti–DC-SIGN (or anti-CD55 or anti-CD46) and 10 μg/ml FITC-CTxB. Co-patching was induced by adding secondary Ab (Materials and methods), and, after fixation in PFA, cells were analyzed by confocal microscopy. Merged images are shown in the right panel. Results are representatives of multiple cells in three independent experiments. Bar, 5 μm.
Figure 3.
Figure 3.
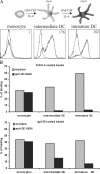
DC-SIGN cell surface distribution during monocyte-derived DC development. DC-SIGN binding activity was monitored during development of monocyte-derived DCs. As shown in the box, intermediate DCs indicate cells harvested after 3 d of monocytes differentiation. (A) The expression levels of DC-SIGN on monocytes, intermediate and immature DCs were assessed by FACS® analysis. The dotted line histogram represents the isotype control, and the thick line histogram indicates the specific staining with anti–DC-SIGN (AZN-D1). Mean fluorescence intensity is indicated. One representative donor is shown. (B) The adhesion to ICAM-3 and gp120 was determined using 1 μm ligand-coated fluorescent beads. Specificity was determined by measuring binding in presence of AZN-D1. No blocking was observed in presence of isotype control (not depicted). One representative experiments out of three is shown. (C) Intermediate and immature DCs were let adhere onto fibronectin-coated formvar film, specifically labeled for DC-SIGN with 10-nm gold particles (Materials and methods), and analyzed by TEM. Results are representatives of multiple cells in several independent experiments. Bar, 200 nm.
Figure 3.
Figure 3.
DC-SIGN cell surface distribution during monocyte-derived DC development. DC-SIGN binding activity was monitored during development of monocyte-derived DCs. As shown in the box, intermediate DCs indicate cells harvested after 3 d of monocytes differentiation. (A) The expression levels of DC-SIGN on monocytes, intermediate and immature DCs were assessed by FACS® analysis. The dotted line histogram represents the isotype control, and the thick line histogram indicates the specific staining with anti–DC-SIGN (AZN-D1). Mean fluorescence intensity is indicated. One representative donor is shown. (B) The adhesion to ICAM-3 and gp120 was determined using 1 μm ligand-coated fluorescent beads. Specificity was determined by measuring binding in presence of AZN-D1. No blocking was observed in presence of isotype control (not depicted). One representative experiments out of three is shown. (C) Intermediate and immature DCs were let adhere onto fibronectin-coated formvar film, specifically labeled for DC-SIGN with 10-nm gold particles (Materials and methods), and analyzed by TEM. Results are representatives of multiple cells in several independent experiments. Bar, 200 nm.
Figure 4.
Figure 4.
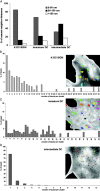
Quantitative analysis of the distribution of gold particles labeling DC-SIGN. The digital images of electron micrographs were processed by a custom-written software based on Labview. Gold labels were counted, and coordinates were assigned to each feature. Subsequently, interparticles distances were calculated using a nearest neighbor distance algorithm. Nearest neighbor distance values were calculated for each image, and the data of several independent experiments were pooled. Subsequently, the nearest neighbor distances were divided into three classes 0–50 nm (gray bar), 50–150 nm (black bar), and >150 nm (white bar), and the percentage of nearest neighbor distance values falling into each class was plotted (A). The partitioning of gold labels in clusters of various size (i.e.: number of particles/cluster) was also quantified. Clusters were defined when gold particles were <50 nm apart from a neighboring particle. The percentage of gold particles involved in the formation of a certain cluster size was calculated for (B) K-DC-SIGN, (C) immature DC, and (D) intermediate DC. The insets are three representative processed digital images, where each type of cluster is shown in a different color. For K-DC-SIGN, one representative experiment out of two is shown; for immature DC, one representative experiment out of six is shown; and for intermediate DCs, one representative experiment out of three is shown.
Figure 5.
Figure 5.
DC-SIGN resides in lipid rafts on immature DCs. (A) DC-SIGN–mediated adhesion to ligand-coated fluorescent beads (1-μm diam) on immature DCs was measured after cholesterol depletion by 20 mM MCD. The assay was performed as described in Fig. 2 A. Data shown are means ± SD of one representative experiment performed in triplicate out of three. One representative experiment out of three is shown. (B) Confocal microscopy analysis of copatching of DC-SIGN and GM1 on immature DCs. Staining was performed as described in Fig. 2 C. Cells were analyzed by confocal microscopy. Merged images are shown in the right panel. Results are representative of multiple cells in two independent experiments. Bar, 5 μm. (C) Whole-mount samples of immature DCs were double labeled for DC-SIGN (5 nm gold) and the raft marker GM1 (10 nm gold) and analyzed by TEM. Thin white arrows indicate GM1 colocalizing in DC-SIGN microdomains. Thick white arrows indicate DC-SIGN microdomains with no GM1. Black arrow indicates GM1 alone. Results are representatives of multiple cells in two independent experiments. Bar, 50 nm.
Figure 5.
Figure 5.
DC-SIGN resides in lipid rafts on immature DCs. (A) DC-SIGN–mediated adhesion to ligand-coated fluorescent beads (1-μm diam) on immature DCs was measured after cholesterol depletion by 20 mM MCD. The assay was performed as described in Fig. 2 A. Data shown are means ± SD of one representative experiment performed in triplicate out of three. One representative experiment out of three is shown. (B) Confocal microscopy analysis of copatching of DC-SIGN and GM1 on immature DCs. Staining was performed as described in Fig. 2 C. Cells were analyzed by confocal microscopy. Merged images are shown in the right panel. Results are representative of multiple cells in two independent experiments. Bar, 5 μm. (C) Whole-mount samples of immature DCs were double labeled for DC-SIGN (5 nm gold) and the raft marker GM1 (10 nm gold) and analyzed by TEM. Thin white arrows indicate GM1 colocalizing in DC-SIGN microdomains. Thick white arrows indicate DC-SIGN microdomains with no GM1. Black arrow indicates GM1 alone. Results are representatives of multiple cells in two independent experiments. Bar, 50 nm.
Figure 6.
Figure 6.
DC-SIGN microdomains on immature DCs bind virus-sized particles. Green fluorescent microbeads (40-nm diam) were coated with gp120 and added to the cells in a ratio of 20 beads/cell. The cells were incubated for 30 min at 37°C, washed, and fixed in PFA. DC-SIGN was stained with AZN-D1 and Alexa 647–conjugated goat anti–mouse Ab (red). Subsequently, the cells were mounted onto poly-l-lysine–coated glass coverslips and analyzed by confocal microscopy. The overview of binding to gp120 microbeads of (A) intermediate DCs and (D) immature DCs is shown. Two representative cells of (B) intermediate and (E) immature DCs are shown. Specific block with 100 μg/ml mannan was also performed by preincubating the cells at RT for 10 min before adding the microbeads (C and F); bars, 5 μm. Similar results were obtained with ICAM-3–coated microbeads (not depicted). (G) Binding of K-DC-SIGN, intermediate DCs, and immature DCs to soluble gp120 was also performed: 50,000 cells were incubated with 50 mM biotinylated gp120 for 30 min on ice, in presence or absence of 20 μg/ml anti–DC-SIGN blocking mAb (AZN-D1). A subsequent incubation with Alexa 488–conjugated streptavidin for 30 min on ice followed, and gp120 molecules bound to the cells were detected by flow cytometry. The values represent the mean of three independent experiments ±SD.
Figure 6.
Figure 6.
DC-SIGN microdomains on immature DCs bind virus-sized particles. Green fluorescent microbeads (40-nm diam) were coated with gp120 and added to the cells in a ratio of 20 beads/cell. The cells were incubated for 30 min at 37°C, washed, and fixed in PFA. DC-SIGN was stained with AZN-D1 and Alexa 647–conjugated goat anti–mouse Ab (red). Subsequently, the cells were mounted onto poly-l-lysine–coated glass coverslips and analyzed by confocal microscopy. The overview of binding to gp120 microbeads of (A) intermediate DCs and (D) immature DCs is shown. Two representative cells of (B) intermediate and (E) immature DCs are shown. Specific block with 100 μg/ml mannan was also performed by preincubating the cells at RT for 10 min before adding the microbeads (C and F); bars, 5 μm. Similar results were obtained with ICAM-3–coated microbeads (not depicted). (G) Binding of K-DC-SIGN, intermediate DCs, and immature DCs to soluble gp120 was also performed: 50,000 cells were incubated with 50 mM biotinylated gp120 for 30 min on ice, in presence or absence of 20 μg/ml anti–DC-SIGN blocking mAb (AZN-D1). A subsequent incubation with Alexa 488–conjugated streptavidin for 30 min on ice followed, and gp120 molecules bound to the cells were detected by flow cytometry. The values represent the mean of three independent experiments ±SD.
Figure 7.
Figure 7.
Clustered DC-SIGN molecules efficiently bind HIV-1 particles and infect PBMC. DC-SIGN on immature DCs enhances HIV-1 infection as measured in a DC-PBMC coculture. Either intermediate or immature DCs (1.5 × 10⁶) were preincubated for 20 min at RT with or without blocking mAb against 20 μg/ml DC-SIGN (AZN-D1 and AZN-D2). Preincubated intermediate or immature DCs were pulsed for 2 h with HIV-1 (M-tropic HIV-1Ba-L strain), and unbound virus particles and mAb were washed away. Subsequently, DCs were cocultured with activated PBMC (1.5 × 10⁶) for 7 d. Coculture supernatants were collected, and p24 antigen levels were measured by ELISA. Black histogram represents PBMC infected in the absence of DCs. One representative experiment out of two is shown.
Figure 8.
Figure 8.
DC-SIGN microdomains enhances binding of virus-sized particles with respect to isolated DC-SIGN molecules. Beads of 1-μm diam are saturated with numerous coated ligand molecules that can engage simultaneous interactions with several individual DC-SIGN molecules. These multiple interactions may strengthen the binding both with random and clustered DC-SIGN. In contrast, when virus-sized particles are used, the contact surface and therefore, the number of ligand molecules is much smaller. Consequently, only interactions with DC-SIGN molecules in highly organized multiprotein assemblies may result in stable binding of virus particles.

References

    1. Akira, S. 2003. Mammalians Toll-like receptors. Curr. Opin. Immunol. 15:5–11. - PubMed
    1. Alvarez, C.P., F. Lasal, J. Carrillo, O. Muniz, A.L. Corbi, and R. Delgado. 2002. C-type lectins DC-SIGN and L-SIGN mediate cellular entry by Ebola virus in cis and in trans. J. Virol. 76:6841–6844. - PMC - PubMed
    1. Banchereau, J., and R.M. Steinman. 1998. Dendritic cells and the control of immunity. Nature. 392:245–252. - PubMed
    1. Brown, D.A., and E. London. 2000. Structure and function of sphingolipid- and cholesterol-rich membrane rafts. J. Biol. Chem. 275:17221–17224. - PubMed
    1. Cambi, A., K. Gijzen, I.J.M. de Vries, R. Torensma, B. Joosten, G.J. Adema, M.G. Netea, B.J. Kullberg, L. Romani, and C.G. Figdor. 2003. The C-type lectin DC-SIGN (CD209) is an antigen-uptake receptor for Candida albicans on dendritic cells. Eur. J. Immunol. 33:532–538. - PubMed

Publication types

MeSH terms