

Within- and between-lake variability in the composition of bacterioplankton communities: investigations using multiple spatial scales
- PMID: 14711644
- PMCID: PMC321240
- DOI: 10.1128/AEM.70.1.214-223.2004
Within- and between-lake variability in the composition of bacterioplankton communities: investigations using multiple spatial scales
Abstract
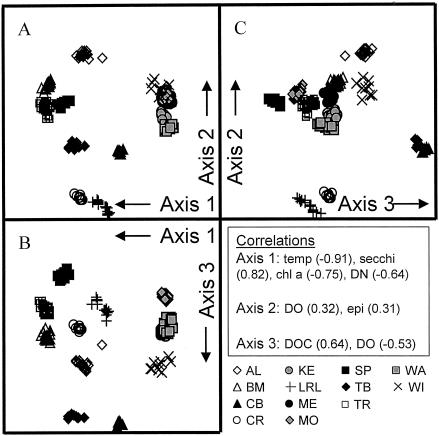
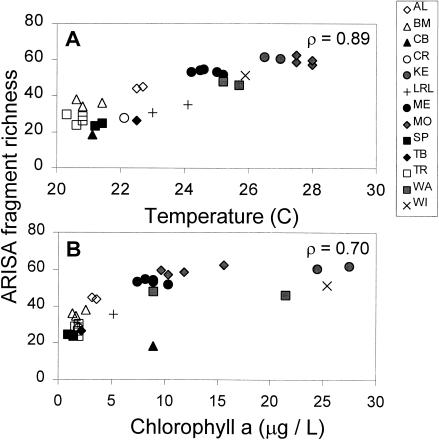
This study examined the similarity of epilimnetic bacterial community composition (BCC) across several within- and among-lake spatial scales, and the environmental factors giving rise to similar bacterial communities in different lakes were also explored. Samples were collected from 13 northern and southern Wisconsin lakes representing gradients in lake size, productivity, dissolved organic carbon and humic acid contents, and pH. Hypotheses regarding patchy distribution of bacterial communities in lakes were tested by comparing samples collected from nearby (tens of meters) and distant (hundreds of meters) sampling sites in the same lake. BCC was characterized by using a molecular fingerprinting technique, automated ribosomal intergenic spacer analysis (ARISA). Overall, samples collected at the 10-m, 100-m, and between-lake scales differed by 13, 17, and 75%, respectively. Variation at these last two scales was significant. The development of within-lake variation in BCC appeared to depend on the isolation of water by lake shoreline features such as bays or narrow constrictions. ARISA profiles from northern lakes had fewer peaks and were less similar to each other than were those of the southern lakes, suggesting that regional features do not necessarily lead to the development of similar bacterial communities. Lakes at similar positions on productivity and dissolved organic carbon concentration gradients had similar bacterial communities, and bacterial diversity was positively correlated with lake productivity and water temperature. Factorial studies taking into account these gradients, as well as regional spatial scales, should provide much insight into the nature of aquatic bacterial biogeography.
Figures


References
-
- Bosshard, P. P., R. Stettler, and R. Bachofen. 2000. Seasonal and spatial community dynamics in the meromictic Lake Cadagno. Arch. Microbiol. 174:168-174. - PubMed
-
- Brezonik, P. L., L. A. Baker, J. R. Eaton, T. M. Frost, P. Garrison, T. K. Kratz, J. J. Magnuson, W. J. Rose, B. K. Shephard, W. A. Swenson, C. J. Watras, and K. E. Webster. 1986. Experimental acidification of Little-Rock Lake, Wisconsin. Water Air Soil Pollut. 31:115-121.
-
- Casamayor, E. O., G. Muyzer, and C. Pedros-Alio. 2001. Composition and temporal dynamics of planktonic archaeal assemblages from anaerobic sulfurous environments studied by 16S rDNA denaturing gradient gel electrophoresis and sequencing. Aquat. Microb. Ecol. 25:237-246.
-
- Casamayor, E. O., H. Schafer, L. Baneras, C. Pedros-Alio, and G. Muyzer. 2000. Identification of and spatio-temporal differences between microbial assemblages from two neighboring sulfurous lakes: comparison by microscopy and denaturing gradient gel electrophoresis. Appl. Environ. Microbiol. 66:499-508. - PMC - PubMed
-
- Clarke, K. R. 1993. Non-parametric multivariate analyses of changes in community structure. Aust. J. Ecol. 18:117-143.
Publication types
MeSH terms
Substances
LinkOut - more resources
Full Text Sources
