

Bacterial diversity in agricultural soils during litter decomposition
- PMID: 14711676
- PMCID: PMC321295
- DOI: 10.1128/AEM.70.1.468-474.2004
Bacterial diversity in agricultural soils during litter decomposition
Abstract
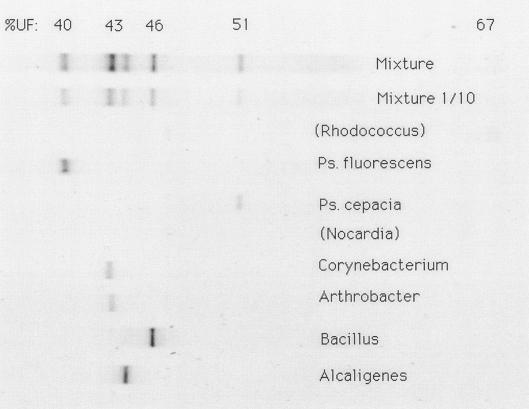
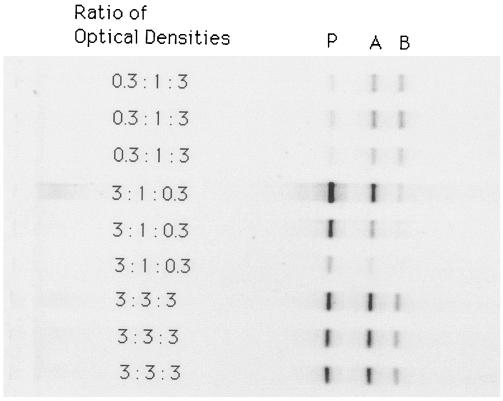
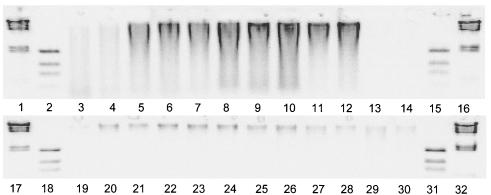
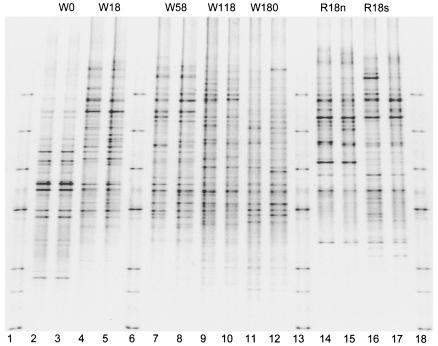
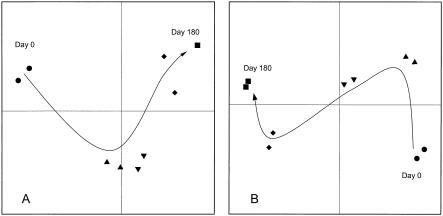
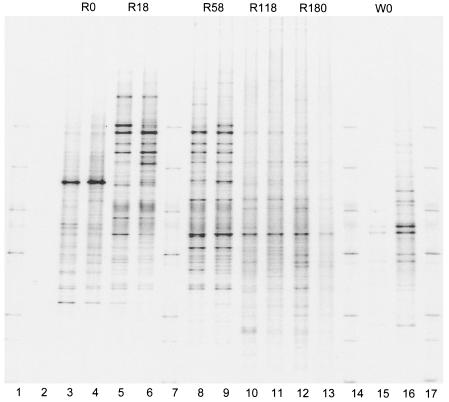
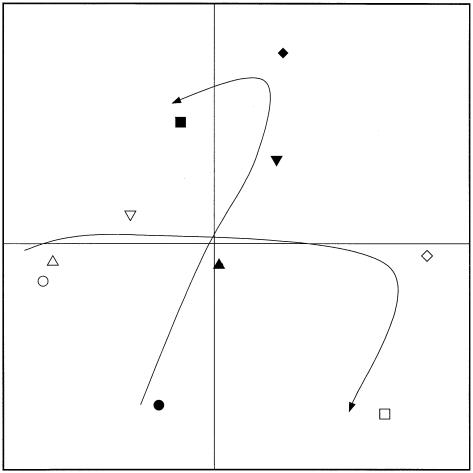
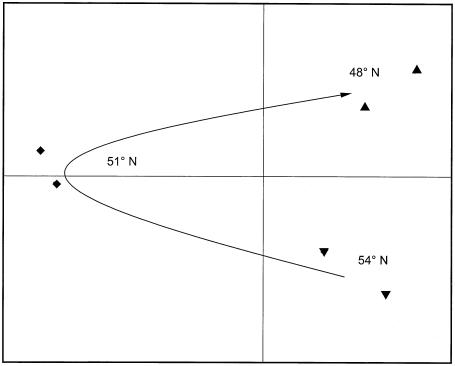
Denaturing gradient gel electrophoresis (DGGE) of amplified fragments of genes coding for 16S rRNA was used to study the development of bacterial communities during decomposition of crop residues in agricultural soils. Ten strains were tested, and eight of these strains produced a single band. Furthermore, a mixture of strains yielded distinguishable bands. Thus, DGGE DNA band patterns were used to estimate bacterial diversity. A field experiment performed with litter in nylon bags was used to evaluate the bacterial diversity during the decomposition of readily degradable rye and more refractory wheat material in comparable luvisols and cambisols in northern, central, and southern Germany. The amount of bacterial DNA in the fresh litter was small. The DNA content increased rapidly after the litter was added to the soil, particularly in the rapidly decomposing rye material. Concurrently, diversity indices, such as the Shannon-Weaver index, evenness, and equitability, which were calculated from the number and relative abundance (intensity) of the bacterial DNA bands amplified from genes coding for 16S rRNA, increased during the course of decomposition. This general trend was not significant for evenness and equitability at any time. The indices were higher for the more degradation-resistant wheat straw than for the more easily decomposed rye grass. Thus, the DNA band patterns indicated that there was increasing bacterial diversity as decomposition proceeded and substrate quality decreased. The bacterial diversity differed for the sites in northern, central, and southern Germany, where the same litter material was buried in the soil. This shows that in addition to litter type climate, vegetation, and indigenous microbes in the surrounding soil affected the development of the bacterial communities in the litter.
Figures
References
-
- Atlas, R. M., and R. Bartha. 1998. Microbial ecology: fundamentals and applications. Addison-Wesley Publishing Company, Reading, Pa.
-
- Beare, M. 1997. Fungal and bacterial pathways of organic matter decomposition and nitrogen mineralization in arable soils, p. 37-70. In L. Brussard and R. Ferrera-Cerrato (ed.), Soil ecology in sustainable agricultural systems. CRC Lewis Publishers, Boca Raton, Fla.
-
- Bengtsson, J. 2002. Disturbance and resilience in soil animal communities. Eur. J. Soil Biol. 38:119-125.
-
- Bloem, J., and A. M. Breure. 2003. Microbial indicators, p. 259-282. In B. A. Markert, A. M. Breure, and H. G. Zechmeister (ed.), Bioindicators/biomonitors—principles, assessment, concepts. Elsevier, Amsterdam, The Netherlands.
Publication types
MeSH terms
Substances
LinkOut - more resources
Full Text Sources
