. 2004 Jan 20;101(3):711-6.
doi: 10.1073/pnas.0304849101. Epub 2004 Jan 8.

High-resolution molecular structure of a peptide in an amyloid fibril determined by magic angle spinning NMR spectroscopy

Affiliations

High-resolution molecular structure of a peptide in an amyloid fibril determined by magic angle spinning NMR spectroscopy

Christopher P Jaroniec et al. Proc Natl Acad Sci U S A. .

Abstract

Amyloid fibrils are self-assembled filamentous structures associated with protein deposition conditions including Alzheimer's disease and the transmissible spongiform encephalopathies. Despite the immense medical importance of amyloid fibrils, no atomic-resolution structures are available for these materials, because the intact fibrils are insoluble and do not form diffraction-quality 3D crystals. Here we report the high-resolution structure of a peptide fragment of the amyloidogenic protein transthyretin, TTR(105-115), in its fibrillar form, determined by magic angle spinning NMR spectroscopy. The structure resolves not only the backbone fold but also the precise conformation of the side chains. Nearly complete (13)C and (15)N resonance assignments for TTR(105-115) formed the basis for the extraction of a set of distance and dihedral angle restraints. A total of 76 self-consistent experimental measurements, including 41 restraints on 19 backbone dihedral angles and 35 (13)C-(15)N distances between 3 and 6 A were obtained from 2D and 3D NMR spectra recorded on three fibril samples uniformly (13)C, (15)N-labeled in consecutive stretches of four amino acids and used to calculate an ensemble of peptide structures. Our results indicate that TTR(105-115) adopts an extended beta-strand conformation in the amyloid fibrils such that both the main- and side-chain torsion angles are close to their optimal values. Moreover, the structure of this peptide in the fibrillar form has a degree of long-range order that is generally associated only with crystalline materials. These findings provide an explanation of the unusual stability and characteristic properties of this form of polypeptide assembly.


Figures
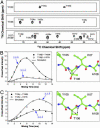
Fig. 1.
Fig. 1.
Three-dimensional ZF TEDOR 13C–15N distance measurements in TTR(105–115)YTIA fibrils. (A) Strips from a 2D 15N–13C chemical shift correlation spectrum (30) acquired with a TEDOR mixing time of 6.0 ms. Cross-peaks corresponding to distances of ≈4–6 Å are observed for mixing times in the 6- to 12-ms regime. The resonance assignments for TTR(105–115) have been presented (26). (B) Experimental (○ and •) and simulated (—) intensities for the T106 13Cβ–T106 15N(•) and T106 13Cβ–I107 15N(○) cross-peaks as a function of the TEDOR mixing time, and the relevant molecular fragment showing the measured distances. (C) Same as in B but for T106 13Cγ. The distance measurements are summarized in Table 1 and presented in detail in Table 2.
Fig. 2.
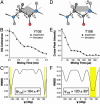
Fig. 2.
Representative torsion angle measurements in TTR(105–115)YTIA fibrils. (AC) Measurement of ψY105 using a 3D 15Ni13Cαi13C′i15Ni+1 experiment (33, 34). (A) Schematic of the peptide backbone. The projection angle Θ between the 13Cαi15Ni and 13C′i15Ni+1 dipole vectors is indicated. (B) Experimental (•) and simulated (—) intensities of the cross-peak corresponding to 13Cα13C′ double-quantum coherence for residue Y105 in a 13C double quantum–single quantum correlation spectrum (not shown) as a function of the 13C–15N dipolar dephasing time. The time evolution of the double-quantum coherence reports on the projection angle Θ between the 13Cαi15Ni and 13C′i15Ni+1 dipole vectors. (C) Plot of the rmsd between the experimental dephasing curve in B and simulated dephasing curves obtained for different values of ψ. Allowed solutions are indicated by yellow rectangles. (DF) Measurement of ψT106 performed by using a 3D 1HNi+115Ni+113Cαi1Hαi experiment (32). (D) Schematic of the peptide backbone. The projection angle Θ between the 15Ni+11HNi+1 and 13Cαi1Hαi dipole vectors is indicated. (E) Experimental (•) and simulated (—) intensities for the I107 15N–T106 13Cα cross-peak in a 15N–13C correlation spectrum as a function of the X–1H dipolar dephasing time (X = 13C, 15N). The time evolution of the cross-peak intensity reports on the projection angle Θ between the 15Ni+11HNi+1 and 13Cαi1Hαi dipole vectors. (F) Plot of the rmsd between the experimental dephasing curve in E and simulated dephasing curves obtained for different values of ψ. Allowed solutions are indicated by the yellow rectangle. The torsion angle measurements are summarized in Table 1 and presented in detail in Table 3.
Fig. 3.
Fig. 3.
Three-dimensional structure of TTR(105–115) in the amyloid fibril determined by using MAS solid-state NMR. (A) Structure of TTR(105–115) (see C below for details) with the experimental NMR restraints (Tables 2 and 3) superimposed. Measured 13C–15N distances are indicated by the red lines, and measured torsion angles between atoms A-B-C-D are indicated by the B—C bond colored yellow. (B) Ensemble of 20 low-energy structures generated by using simulated annealing molecular dynamics implemented in cns (35), based on experimental NMR distance and dihedral angle restraints (Table 1) and database-derived restraints for the Tyr and Leu side chains (40). The peptide structures are superimposed over the backbone atoms of residues I107–P113. The coordinate rmsd for residues I107–P113 was 0.40 Å (backbone) and 0.63 Å (all heavy atom), and for residues Y105–S115 the rmsd values were 0.69 Å (backbone) and 1.24 Å (all heavy atom). (C) Ribbon representation of the structure of TTR(105–115) in the amyloid fibril with side chains shown as stick models. A typical conformer from the ensemble closest to the average structure is shown. The figure was prepared by using the program molmol (39). C, N, and O atoms are indicated in black, blue, and red, respectively. The average torsion angles in TTR(105–115) are listed in Table 4.

Similar articles

Cited by

References

    1. Sunde, M. & Blake, C. C. F. (1998) Q. Rev. Biophys. 31, 1–39. - PubMed
    1. Kelly, J. W. (1998) Curr. Opin. Struct. Biol. 8, 101–106. - PubMed
    1. Dobson, C. M. (2001) Philos. Trans. R. Soc. London B 356, 133–145. - PMC - PubMed
    1. Guijarro, J. I., Sunde, M., Jones, J. A., Campbell, I. D. & Dobson, C. M. (1998) Proc. Natl. Acad. Sci. USA 95, 4224–4228. - PMC - PubMed
    1. Fändrich, M., Fletcher, M. A. & Dobson, C. M. (2001) Nature 410, 165–166. - PubMed

Publication types

Associated data