. 2004 Jan 27;101(4):980-5.
doi: 10.1073/pnas.0307612100. Epub 2004 Jan 8.

Coregulator-dependent facilitation of chromatin occupancy by GATA-1

Affiliations

Coregulator-dependent facilitation of chromatin occupancy by GATA-1

Saumen Pal et al. Proc Natl Acad Sci U S A. .

Abstract

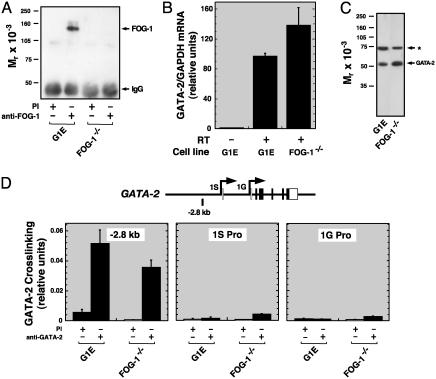
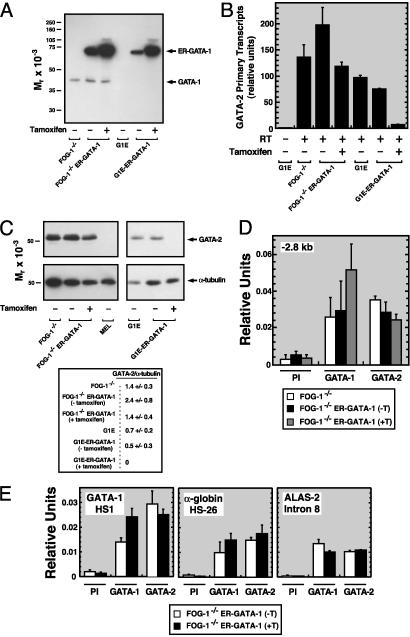
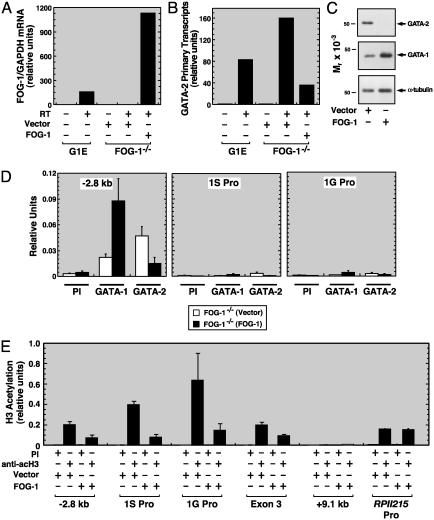
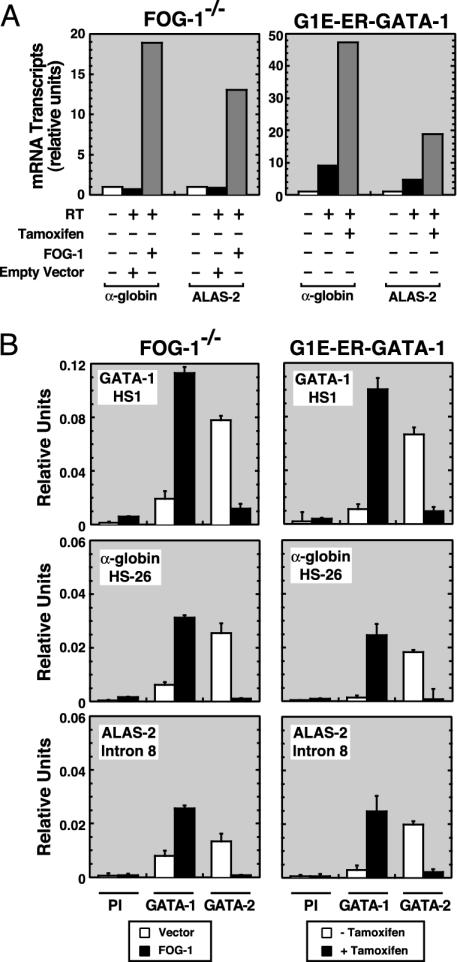
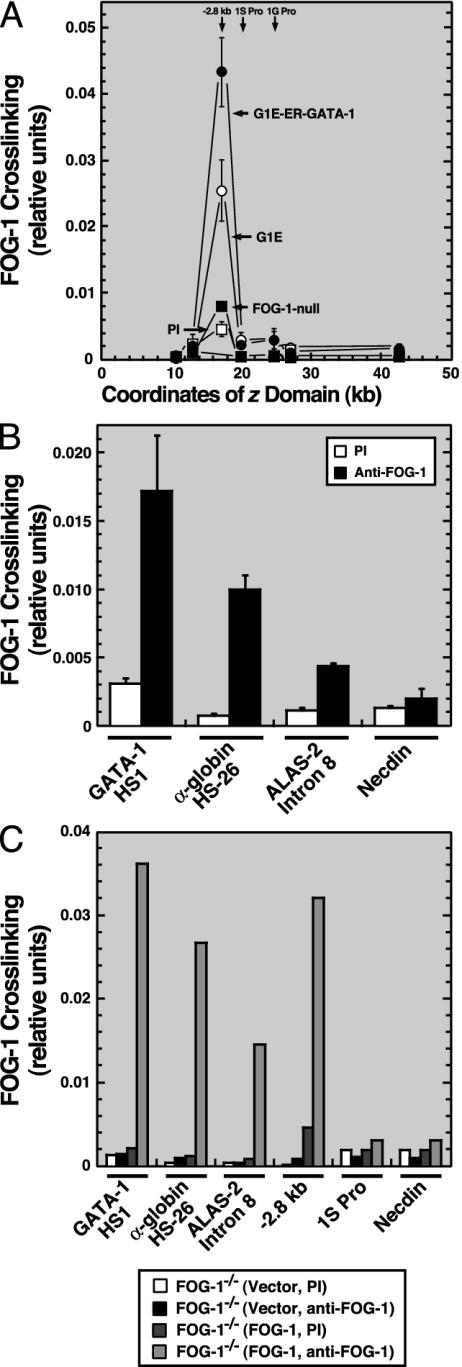
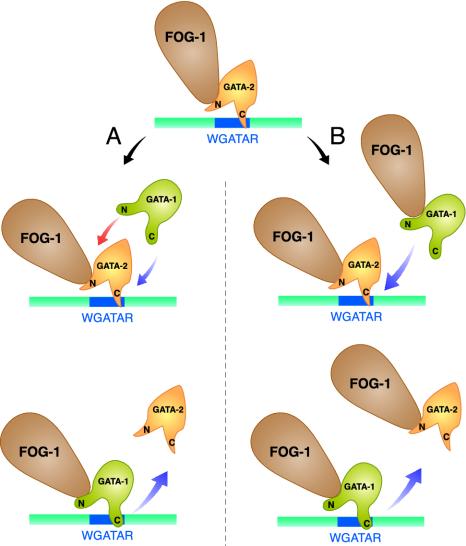
Coregulator recruitment by DNA-bound factors results in chromatin modification and protein-protein interactions, which regulate transcription. However, the mechanism by which the Friend of GATA (FOG) coregulator mediates GATA factor-dependent transcription is unknown. We showed previously that GATA-1 replaces GATA-2 at an upstream region of the GATA-2 locus, and that this GATA switch represses GATA-2. Genetic complementation analysis in FOG-1-null hematopoietic precursors revealed that FOG-1 is not required for establishment or maintenance of the active GATA-2 domain, but is critical for the GATA switch. Analysis of GATA factor binding to additional loci also revealed FOG-1-dependent GATA switches. Thus, FOG-1 facilitates chromatin occupancy by GATA-1 at sites bound by GATA-2. We propose that FOG-1 is a prototype of a new class of coregulators termed chromatin occupancy facilitators, which confer coregulation in certain contexts via enhancing trans-acting factor binding to chromatin in vivo.


Figures

Fig. 1.
Fig. 1.
GATA-2 transcription is FOG-1 independent. (A) Western blot analysis of FOG-1 expression in G1E and FOG-1–/– cells. Whole cell extracts were immunoprecipitated with anti-FOG-1 polyclonal antibody or preimmune (PI) serum and were analyzed by Western blotting with anti-FOG-1 antibody. (B) Quantitative real-time RT-PCR was used to measure GATA-2 mRNA expression in G1E and FOG-1–/– cells. Exon 3/exon 4 primers amplified GATA-2 transcripts arising from usage of both 1S and 1G promoters (46). GAPDH mRNA was measured as a control. The plots depict the mean GATA-2/GAPDH ratios (mean ± SEM, three independent experiments). (C) Western blot analysis of GATA-2 expression in whole cell lysates from G1E and FOG-1–/– cells. A broadly expressed cross-reactive band is denoted by the asterisk. (D) Quantitative ChIP analysis of GATA-2 binding to the GATA-2 locus in G1E and FOG-1–/– cells (mean ± SEM of three independent experiments). The diagram at the top of the graph represents the murine GATA-2 locus. The vertical line below the locus indicates the position of the –2.8-kb amplicon, upstream of the 1S exon.
Fig. 2.
Fig. 2.
High-level overexpression of ER–GATA-1 does not efficiently repress GATA-2 transcription in FOG-1–/– cells. (A) Western blot analysis of GATA-1 and ER–GATA-1 expression in whole cell lysates from untreated and tamoxifen-treated (1 μM, 24 h) FOG-1–/–, FOG-1–/––ER–GATA-1, G1E, and G1E–ER–GATA-1 cells. (B) Relative expression of GATA-2 primary transcripts expressed from both 1S and 1G promoters. Quantitative real-time RT-PCR was used to measure relative GATA-2 primary transcript levels, which were normalized by the levels of GAPDH transcripts (mean ± SEM, three independent experiments). (C)(Upper) Western blot analysis of GATA-2 in whole cell lysates from the same samples as those analyzed by RT-PCR. Lysates from DMSO-induced mouse erythroleukemia cells were used as a negative control for GATA-2 expression. Blots were probed with anti-GATA-2 antibody and then stripped and reprobed with anti-α-tubulin antibody. A representative blot of GATA-2 and α-tubulin is shown. (Lower) The GATA-2/α-tubulin ratios, which were quantitated via densitometric analysis (mean ± SEM of three independent experiments). (D) Quantitative ChIP analysis of GATA-1 and GATA-2 binding to the –2.8 kb region of GATA-2 locus in untreated and tamoxifen-treated (1μM, 24 h) FOG-1–/– and FOG-1–/–-ER–GATA-1 cells (mean ± SEM, five independent experiments). (E) Quantitative ChIP analysis of GATA-1 and GATA-2 binding to GATA-1 HS1, α-globin HS-26, and ALAS-2 intron 8 in untreated and tamoxifen-treated (1 μM, 24 h) FOG-1–/– and FOG-1–/–-ER–GATA-1 cells (mean ± SEM of three independent experiments).
Fig. 3.
Fig. 3.
FOG-1 is required for the GATA-switch, for broad histone deacetylation, and for repression of GATA-2 transcription. (A) Quantitative real-time RT-PCR analysis of FOG-1 mRNA expression in G1E cells and in FOG-1–/– cells infected with empty or FOG-1-expressing retroviral vectors. Relative expression levels were normalized by GAPDH expression (mean ± SEM of two independent experiments) and plotted with respect to the values of control G1E cell samples lacking RT. (B) Quantitative RT-PCR analysis of GATA-2 primary transcripts in G1E cells, FOG-+–/– cells containing empty vector, and FOG-1 rescued FOG-1–/– cells (mean from two independent experiments). (C) Western blot analysis of GATA-2 (Top) and GATA-1 (Middle) protein levels. Whole cell lysates from FOG-1–/– cells infected with empty or FOG-1-expressing retrovirus were subjected to Western blot analysis with anti-GATA-2 or anti-GATA-1 antibodies. Blots were stripped and reprobed with anti-α-tubulin antibody. A representative Western blot of α-tubulin is shown (Bottom). (D) Quantitative ChIP analysis of GATA-1 and GATA-2 binding to the GATA-2 locus in FOG-1–/– cells infected with empty or FOG-1-expressing retrovirus (mean ± SEM of five independent experiments). (E) Quantitative ChIP analysis of histone H3 acetylation at the GATA-2 locus and the RPII215 promoter after infection of FOG-1–/– cells with empty or FOG-1-expressing retrovirus (mean ± SEM of three independent experiments).
Fig. 4.
Fig. 4.
FOG-1 is required for GATA switches at the GATA-1, α-globin, and ALAS-2 loci. (A) Quantitative RT-PCR analysis of α-globin and ALAS-2 mRNA transcripts in FOG-1–/– cells infected with an empty or FOG-1-expressing retrovirus and in untreated and tamoxifen-treated (10 h) G1E–ER–GATA-1 cells (mean of two independent experiments) (B) Quantitative ChIP analysis of GATA-1 and GATA-2 binding in FOG-1–/– cells infected with an empty or FOG-1-expressing retrovirus and in untreated and tamoxifen-treated G1E–ER–GATA-1 cells (mean ± SEM of three independent experiments).
Fig. 5.
Fig. 5.
FOG-1 occupies sites in which the FOG-1-dependent GATA switches occur. Quantitative ChIP analysis was conducted with anti-FOG-1 antibody in FOG-1–/–, G1E, and tamoxifen-treated G1E–ER–GATA-1 cells. (A) The graph depicts the pattern of endogenous FOG-1 crosslinking at various sites of the GATA-2 locus (mean ± SEM of four independent experiments). The positions of the –2.8 kb, 1S promoter, and 1G promoter amplicons are shown by arrows at the top. (B) Occupancy of chromatin sites by endogenous FOG-1. FOG-1 crosslinking in G1E cells was detected at GATA-1 HS1, α-globin HS-26, ALAS-2 intron 8, but not at the Necdin promoter (mean ± SEM of three independent experiments). (C) Occupancy of chromatin sites by ectopically expressed FOG-1. FOG-1–/– cells were infected with an empty or FOG-1-expressing retrovirus, and FOG-1 occupancy was measured by quantitative ChIP.
Fig. 6.
Fig. 6.
Model of chromatin occupancy facilitator activity of FOG-1. FOG-1 colocalizes with GATA-2 at chromatin sites containing WGATAR motifs. FOG-1 facilitate chromatin occupancy of GATA-1 at such sites. Model A assumes that GATA-1 encounters a GATA-2–FOG-1 complex at the chromatin template. Via interactions between the N-terminal zinc finger of GATA-1 and FOG-1, GATA-1 displaces GATA-2 from the chromatin site. Model B assumes that a GATA-1–FOG-1 complex encounters a GATA-2–FOG-1 complex at the chromatin template. Following a complex switch, the GATA-1–FOG-1 complex would stably occupy the chromatin site.

References

    1. Brownell, J. E., Zhou, J., Ranalli, T., Kobayashi, R., Edmondson, D. G., Roth, S. Y. & Allis, C. D. (1996) Cell 84, 843–851. - PubMed
    1. Laherty, C. D., Yang, W. M., Sun, J. M., Davie, J. R., Seto, E. & Eisenman, R. N. (1997) Cell 89, 349–356. - PubMed
    1. Vignali, M., Steger, D. J., Neely, K. E. & Workman, J. L. (2000) EMBO J. 19, 2629–2640. - PMC - PubMed
    1. Bresnick, E. H., Im, H. & Johnson, K. D. (2003) in Nature Encyclopedia of the Human Genome, ed. Cooper, D. N. (Nature Publishing Group, London), Vol. 3, pp. 260–264.
    1. Weiss, M. J. & Orkin, S. H. (1995) Exp. Hematol. 23, 99–107. - PubMed

Publication types

MeSH terms

LinkOut - more resources