. 2004 Jan 7;24(1):112-20.
doi: 10.1523/JNEUROSCI.4336-03.2004.

Transient electrical coupling delays the onset of chemical neurotransmission at developing synapses

Affiliations

Transient electrical coupling delays the onset of chemical neurotransmission at developing synapses

Theresa M Szabo et al. J Neurosci. .

Abstract

The formation and subsequent elimination of electrical coupling between neurons has been demonstrated in many developing vertebrate and invertebrate nervous systems. The relationship between the disappearance of electrical synaptic connectivity and the appearance of chemical neurotransmission is not well understood. We report here that identified motoneurons from the snail Helisoma formed transient electrical and chemical connections during regeneration both in vivo and in vitro. Electrical connections that formed in vivo were strongest by day 2 and no longer detectable by day 7. During elimination of this electrical connection, an inhibitory chemical connection from 110 onto 19 formed. This sequence of synaptic development was recapitulated in cell culture with a similar time course. The relationship between the appearance of transient electrical coupling and its possible effects on the subsequent chemical synaptogenesis were examined by reducing transient intercellular coupling. Trophic factor-deprived medium resulted in a 66% reduction in coupling coefficient. In these conditions, the unidirectional chemical connection formed readily; in contrast, chemical synaptogenesis was delayed in cell pairs exposed to trophic factors where transient electrical coupling was strong. Dye coupling and synaptic vesicle cycling studies supported electrophysiological results. Exposure to cholinergic antagonists, curare and hexamethonium bromide, which block chemical neurotransmission in these synapses, resulted in prolonged maintenance of the electrical connection. These studies demonstrated an inverse relationship between chemical and electrical connectivity at early stages of synaptic development and suggest a dynamic interaction between these forms of neuronal communication as adult neural networks are constructed or regenerated.


Figures

Figure 1.
Figure 1.
Quantification and assessment of synaptic connectivity. Connectivity between two neurons was determined by injecting current (Iinj) into the presynaptic cell, while recording changes in the membrane potential of both that cell (Vpre) and the postsynaptic (Vpost) one. A, Hyperpolarizing current injection into one cell of an electrically coupled pair resulted in hyperpolarizing presynaptic and postsynaptic voltage changes. Electrical coupling coefficients were determined using voltages measured at points of peak membrane hyperpolarization (•, indicated by arrow). B, C, Depolarizing current injection into a presynaptic neuron resulted in presynaptic APs (bottom traces) and PSPs (middle traces). PSPs at these mixed synapses could contain electrical and/or chemically based components. To distinguish these components, PSP amplitude in the postsynaptic cell was assessed at 95 msec (*, scale bar) after the peak of the presynaptic AP. Time points used for voltage measurement (•, indicated by arrows) identified postsynaptic responses that range from mostly chemical (B) to mostly electrical (C).
Figure 2.
Figure 2.
Neurons 19 and 110 developed electrical and chemical connections in regenerating buccal ganglia in vivo. A, Diagrammatic buccal ganglia illustrating the site of commissural crush (arrow) as well as the caudal 19 and the rostral 110. B, C, Temporal sequence of synapse formation between neurons 110 and 19 during regeneration in vivo. Simultaneous electrophysiological recordings in neurons 19 and 110 were performed from 0 to 4 d of regeneration (post-crush). B, These cells possessed no connectivity (electrical or chemical) in adult ganglia before commissural crush (day 0). By day 2 of regeneration, 19 and 110 possessed peak electrical coupling, which was significantly reduced by day 4 (ANOVA; p = 0.13; post hoc LSD; *p < 0.05). Data represent mean ± SEM. Inset, Representative recording depicting electrical coupling between neurons 110 (bottom trace) and 19 (top trace) on day 2. Horizontal bar equals 1 sec, vertical bar equals 20 mV for the presynaptic trace, 10 mV for the postsynaptic trace. C, Chemical synaptic connectivity developed more slowly, with the greatest number of preparations demonstrating chemical connections on day 4. (For chemical and electrical analysis: d1, n = 7; d2, n = 6; d3, n = 5; d4, n = 6). Inset, Representative recording demonstrating a chemical PSP in neuron 19 (top trace) in response to an evoked AP in neuron 110 (bottom trace). Horizontal bar equals 1 sec, vertical bar equals 20 mV for the presynaptic trace (neuron 110), 10 mV for the postsynaptic trace (neuron 19).
Figure 3.
Figure 3.
Neurons 19 and 110 cultured as spherical somata in non-adhesive conditions formed strong synaptic contacts and exhibited fascicular growth. A, All neurons were cultured alone in CM for 3 d before experimental manipulation to allow for process retraction and the formation of a uniform spherical morphology. Neurons 19 and 110 were then paired into contact in fresh CM, in nonadhesive culture dishes, for 1 or 5 d. B, After 24 hr of contact (d1), soma-soma pairs formed strong, adhesive connections that could not be disrupted without cellular damage. By day 5 of contact (d5), neurons displayed growth of a fascicular mass between somatic partners. Scale bar, 10 μm. C, Neurons 19 and 110 formed synaptic connections in a partner-specific manner. After 1 d paired in cell culture, 19-19 (n = 12), 110-110 (n = 11), and 19-110 (n = 14) all formed strong electrical connections. After 5 d paired in culture, 19-19 (n = 13) and 110-110 (n = 9) ECC values are not significantly different than on day 1. In contrast, 5 d 19-110 ECC values were significantly lower than day 1 values (*n = 18; p < 0.0001).
Figure 4.
Figure 4.
Chemical and electrical synaptic connectivity at 19-110 neuronal contacts were inversely correlated. A, Neurons 19 and 110 were paired for 24 hr in the presence (CM) or absence (DM) of trophic factors. Neuronal pairs in CM (n = 38) possessed ECCs significantly greater than those of cells paired in DM (n = 20; *p < 0.0001). Data represent average bidirectional ECC values for each cell pair. Traces illustrate electrical coupling at representative 19-110 pairs where hyperpolarizing current was injected into neuron 110 (bottom trace). Horizontal bar equals 1 sec, vertical bar equals 20 mV. B, Actual, PSP amplitudes at 95 msec in neuron 19 in response to evoked APs in neuron 110 were significantly greater in DM (n = 20) than in CM (n = 38) after 24 hr of contact (*p < 0.005). In contrast, chemical synaptic connections from neuron 19 onto neuron 110 were virtually absent in these pairs. Labels (19 and 110) refer to the postsynaptic cell. Predicted PSP amplitudes at 95 msec for postsynaptic neuron 19 and postsynaptic neuron 110 (Vp) were calculated using biophysical measurements (including ECC and τ) taken in DM and CM (see Materials and Methods). Vp values for postsynaptic 110 in CM and DM were not different from actual PSP values taken at 95 msec (p > 0.05; CM and DM), and was therefore representative of synapses with no chemical synaptic connections. Vp values for postsynaptic 19 in CM and DM were significantly different from actual PSP values taken at 95 msec (formula imagep < 0.005; formula image
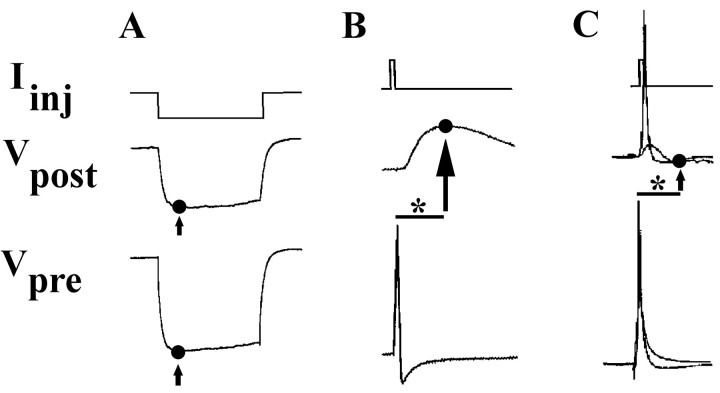
p < 0.005), demonstrating that these voltage changes due to electrical coupling alone did not account for voltage differences at 95 msec post AP. Inset, Traces show a PSP in neuron 19 in response to an evoked AP in neuron 110 in either DM or CM. Horizontal bar equals 95 msec, vertical bar equals 20 mV for presynaptic (bottom) traces, 10 mV for postsynaptic (top) traces.
Figure 5.
Figure 5.
Dye-coupling and vesicle cycling were altered after trophic factor deprivation. 19-110 pairs were cultured for 24 hr in DM or CM, as previously described. For all images, neuron 19 is on the left, and neuron 110 is on the right. A-C, Neurobiotin was pressure-injected into neuron 19 and allowed 1 hr to diffuse across junctional contacts. After avidin immunochemistry, fluorescent images were obtained, and DCCs were determined. DM cultured pairs possessed significantly lower DCC values than CM pairs (C; n = 5 for DM; n = 10 for CM; *p < 0.05). D-F, The styryl dye FM1-43 was bath-applied to cell cultures in the presence of high-K+ saline, and fluorescent images were obtained (D-F; Stain, S). High-K+ saline alone was again bath-applied (Destain, D), and fluorescence intensity was assessed. DM pairs possessed significantly higher fluorescence intensities than CM pairs (F; n = 6 for DM; n = 9 for CM; *p < 0.005). Fluorescence staining distributed over the entire somatic surface of neuron 110 in CM indicated that vesicle cycling was not specifically localized to sites of soma-soma contact (D). Scale bars, 10 μm.
Figure 6.
Figure 6.
Time course of electrical and chemical synaptogenesis in 19-110 soma-soma pairs in culture. Both y-axis labels apply to all four graphs. Current was injected into either presynaptic neuron 110 (left graphs) or presynaptic neuron 19 (right graphs) while membrane potential was simultaneously recorded in both neurons. Left, top, Time course of synapse formation in CM. At 12 and 24 hr, in the presence of strong, trophic factor-induced electrical coupling, PSP amplitudes were at their lowest. By 120 hr, when ECC values were lower (*p < 0.0005), PSP amplitudes were significantly elevated above 24 hr levels (formula image
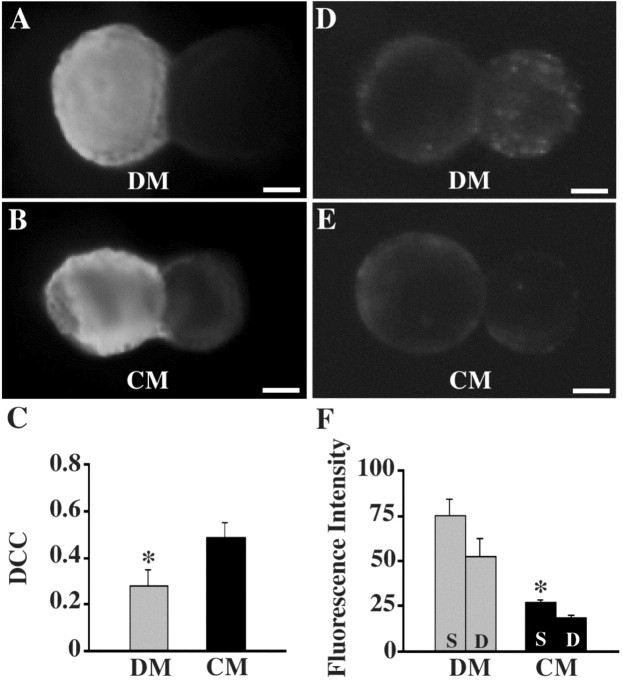
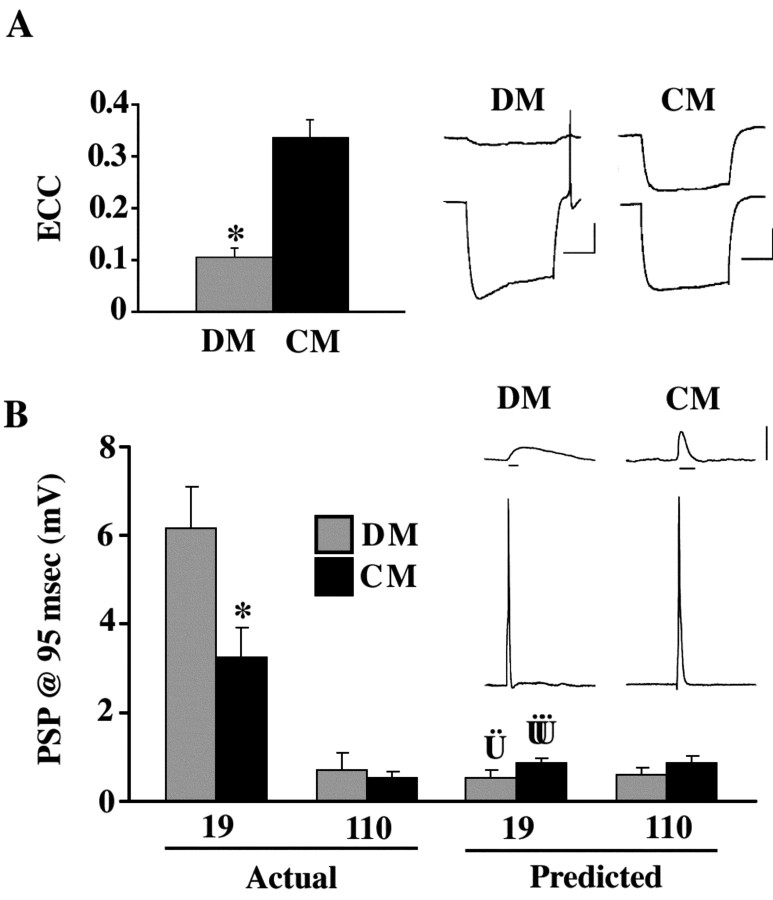
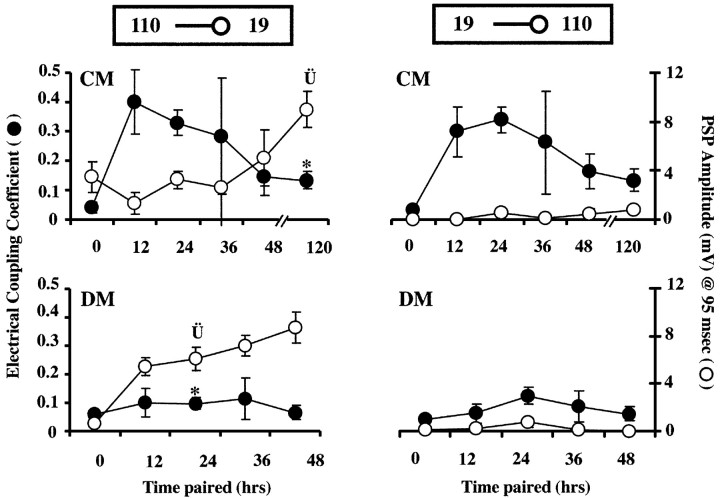
p < 0.002). Left, bottom, Time course of synapse formation in DM. In the absence of trophic factors, electrical coupling never developed strongly, and ECC values were significantly lower than those in CM at 24 hr (*p < 0.0001). At this same time point, significantly higher PSP amplitudes were seen in DM than in CM (formula imagep < 0.05). By 48 hr of contact in DM, ECC values were still low, but PSP amplitudes (8.7 ± 1.3 mV) had increased to values similar to those seen after 5d of culture in CM (CM at 120 hr: 9.0 ± 1.5 mV). Right, top and bottom, Time course of electrical and chemical synapse formation with current injection into neuron 19. ECCs were similar to 110 current injections with strong transient coupling in CM, but not DM. Thus, electrical synaptic connections were non-rectifying in both DM and CM pairs (right vs left graphs of ECC values). PSPs in neuron 110 at 95 msec from AP peak were virtually undetectable in response to stimulation of neuron 19 in both DM and CM. (n: DM, 0 hr = 16, 12 hr = 4, 24 hr = 16, 36 hr = 9, 48 hr = 7; CM, 0 hr = 15, 12 hr = 6, 24 hr = 32, 36 hr = 9, 48 hr = 6, 120 hr = 19.)
Figure 7.
Figure 7.
Blockade of cholinergic communication in 19-110 pairs resulted in enhanced electrical synaptic communication. A, Neurotransmitter release from neuron 110 onto neuron 19 is cholinergic. For cell pairs possessing strictly chemical synaptic connections, PSPs that occurred in neuron 19 in response to APs evoked in neuron 110 were eliminated during bath application of 10 μm curare (d-TC). After curare wash, PSPs returned to their original levels [n = 8; traces represent pre, during (flat) and post application]. Vertical bar equals 10 mV, horizontal bar equals 95 msec. B, Neurotransmitter release from neuron 110 onto neuron 19 results in an inhibitory PSP. Electrodes filled with 1.5 m KAc were used to perform recordings from 19-110 pairs. Under these recording conditions, hyperpolarizing PSPs were detected in neuron 19 in response to APs evoked in neuron 110. Vertical bar equals 5 mV, horizontal bar equals 95 msec. C, 19-110 pairs were paired into contact and cultured for 24 hr in CM containing 10 μm d-TC, 10 μm Hex, or 10 μm vehicle (Co). A significant enhancement of electrical coupling was seen both in the presence of curare (*p < 0.0005) and hexamethonium bromide (†p < 0.005) compared with controls. (ECCs: Co = 0.30 ± 0.06, n = 9; d-TC = 0.73 ± 0.06, n = 6; Hex = 0.59 ± 0.05, n = 8). Histogram represents mean ± SEM.

Similar articles

Cited by

References

    1. Aberg ND, Carlsson B, Rosengren L, Oscarsson J, Isaksson OG, Ronnback L, Eriksson PS (2000) Growth hormone increases connexin-43 expression in the cerebral cortex and hypothalamus. Endocrinology 141: 3879-3886. - PubMed
    1. Barker DL, Wong RG, Kater SB (1982) Separate factors produced by the CNS of the snail Helisoma stimulate neurite outgrowth and choline metabolism in cultured neurons. J Neurosci Res 8: 419-432. - PubMed
    1. Bem T, Le Feuvre Y, Simmers J, Meyrand P (2002) Electrical coupling can prevent expression of adult-like properties in an embryonic neural circuit. J Neurophysiol 87: 538-547. - PubMed
    1. Bennett MV (1997) Gap junctions as electrical synapses. J Neurocytol 26: 349-366. - PubMed
    1. Bennett MVL (1977) Electrical transmission: a functional analysis and comparison to chemical transmission. In: Handbook of physiology (Kandel ER, ed), pp 357-416. Bethesda: American Physiological Society.

Publication types

Substances