

Neural substrates mediating human delay and trace fear conditioning
- PMID: 14715954
- PMCID: PMC6729570
- DOI: 10.1523/JNEUROSCI.0433-03.2004
Neural substrates mediating human delay and trace fear conditioning
Abstract
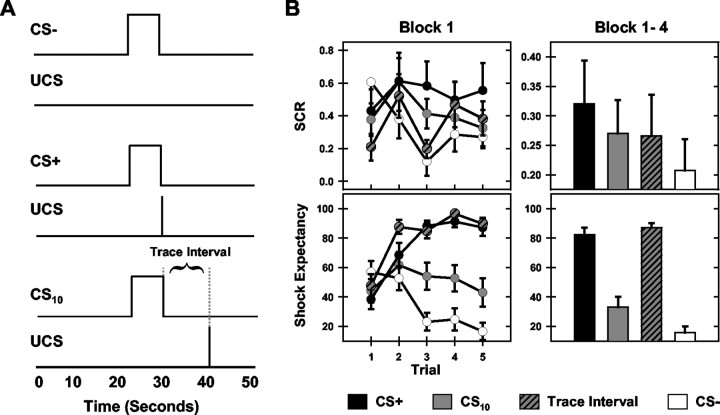
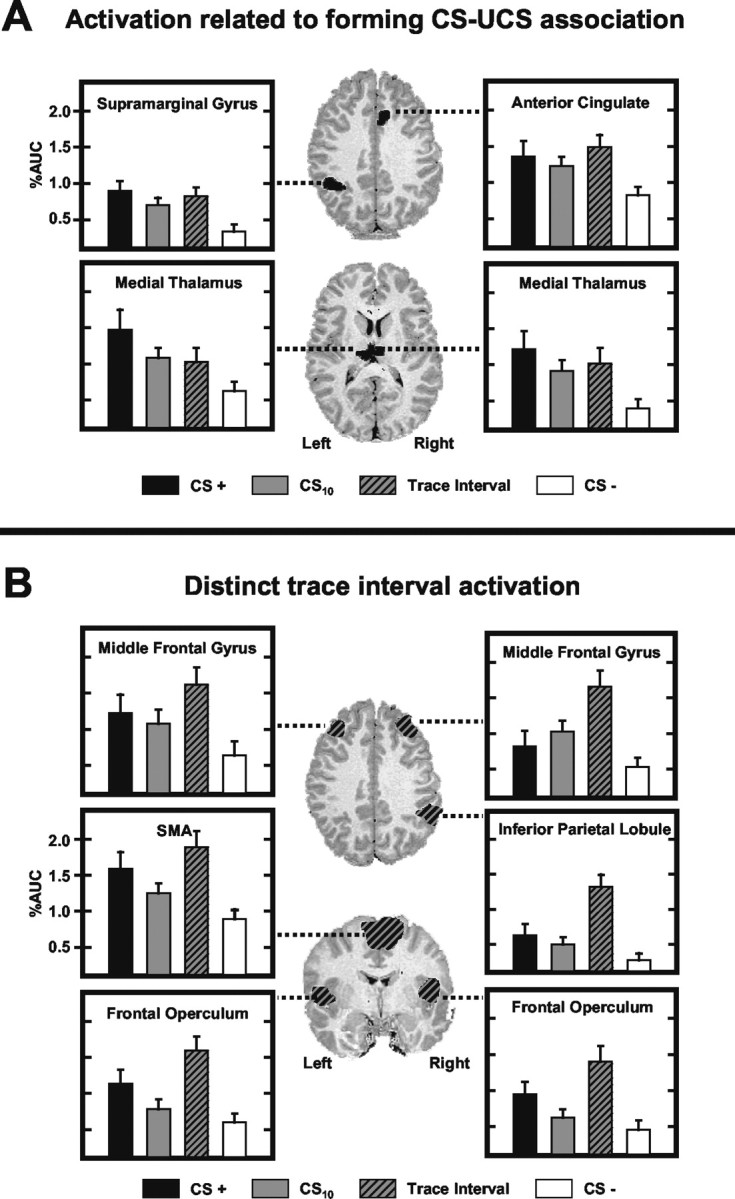
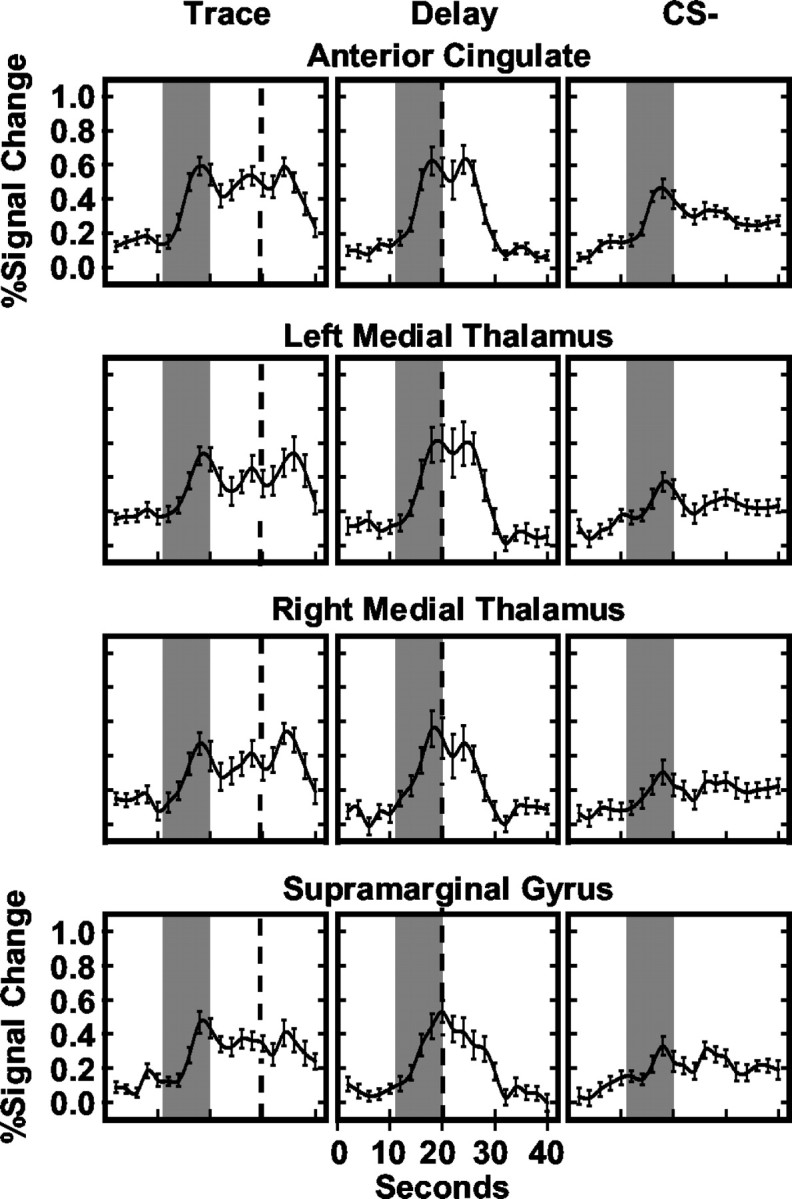
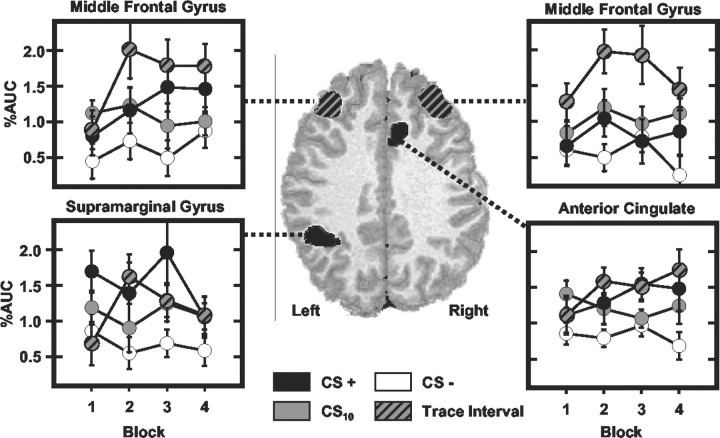
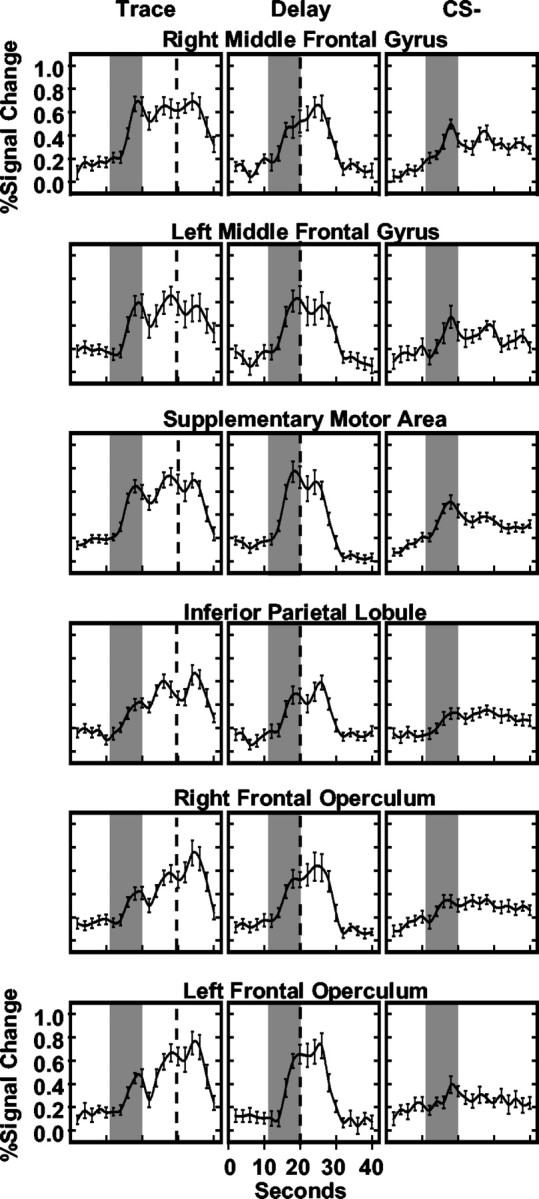
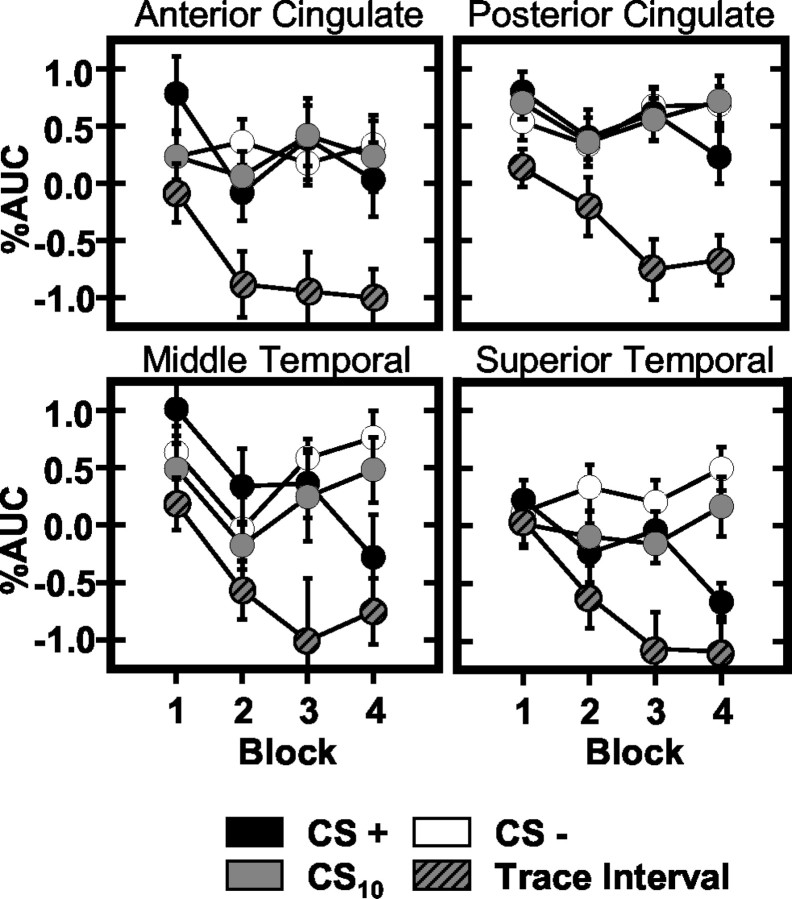
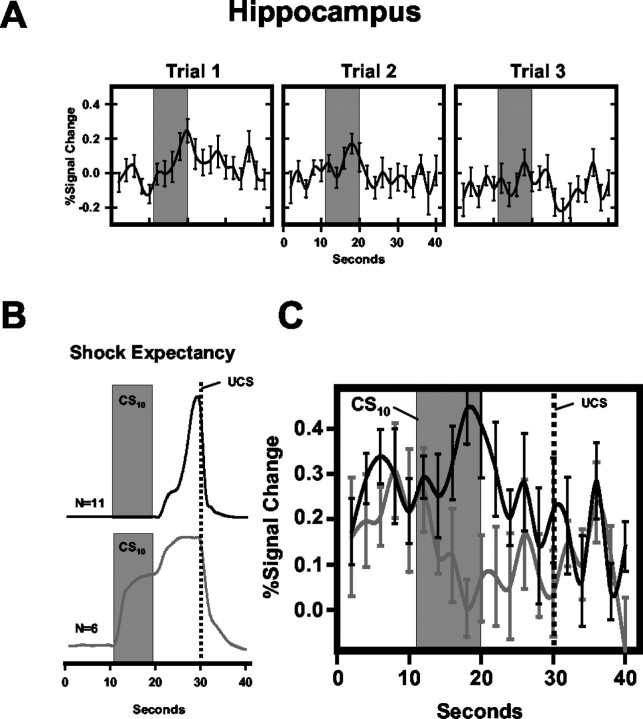
Previous functional magnetic resonance imaging (fMRI) studies with human subjects have explored the neural substrates involved in forming associations in Pavlovian fear conditioning. Most of these studies used delay procedures, in which the conditioned stimulus (CS) and unconditioned stimulus (UCS) coterminate. Less is known about brain regions that support trace conditioning, a procedure in which an interval of time (trace interval) elapses between CS termination and UCS onset. Previous work suggests significant overlap in the neural circuitry supporting delay and trace fear conditioning, although trace conditioning requires recruitment of additional brain regions. In the present event-related fMRI study, skin conductance and continuous measures of UCS expectancy were recorded concurrently with whole-brain blood oxygenation level-dependent (BOLD) imaging during direct comparison of delay and trace discrimination learning. Significant activation was observed within the visual cortex for all CSs. Anterior cingulate and medial thalamic activity reflected associative learning common to both delay and trace procedures. Activations within the supplementary motor area (SMA), frontal operculum, middle frontal gyri, and inferior parietal lobule were specifically associated with trace interval processing. The hippocampus displayed BOLD signal increases early in training during all conditions; however, differences were observed in hippocampal response magnitude related to the accuracy of predicting UCS presentations. These results demonstrate overlapping patterns of activation within the anterior cingulate, medial thalamus, and visual cortex during delay and trace procedures, with additional recruitment of the hippocampus, SMA, frontal operculum, middle frontal gyrus, and inferior parietal lobule during trace conditioning. These data suggest that the hippocampus codes temporal information during trace conditioning, whereas brain regions supporting working memory processes maintain the CS-UCS representation during the trace interval.
Figures
References
-
- Baddeley AD (1992) Working memory. Science 255: 556-559. - PubMed
-
- Bechara A, Tranel D, Damasio H, Adolphs R, Rockland C, Damasio A (1995) Double dissociation of conditioning and declarative knowledge relative to the amygdala and hippocampus in humans. Science 269: 1115-1118. - PubMed
-
- Berger TY, Rinaldi PC, Weisz DJ, Thompson RF (1983) Single-unit analysis of different hippocampal cell types during classical conditioning of rabbit nictitating membrane response. J Neurophysiol 50: 1197-1219. - PubMed
-
- Binder JR, Frost JA, Hammeke TA, Bellgowan PSF (1999) Conceptual processing during the conscious resting state: a functional MRI study. J Cognit Neurosci 11: 80-93. - PubMed
-
- Braver TS, Cohen JD, Nystrom LE, Jonides J, Smith EE, Noll DC (1997) A parametric study of prefrontal cortex involvement in human working memory. NeuroImage 5: 49-62. - PubMed
Publication types
MeSH terms
Grants and funding
LinkOut - more resources
Full Text Sources
Other Literature Sources