. 2004 Jan 13;32(1):e12.
doi: 10.1093/nar/gnh002.

Biological detection of low radiation doses by combining results of two microarray analysis methods

Affiliations

Biological detection of low radiation doses by combining results of two microarray analysis methods

G Mercier et al. Nucleic Acids Res. .

Abstract

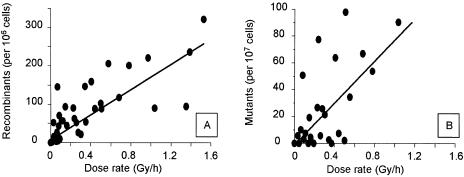
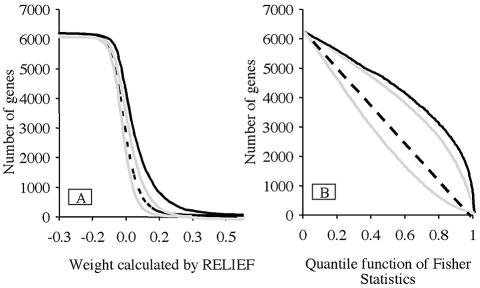
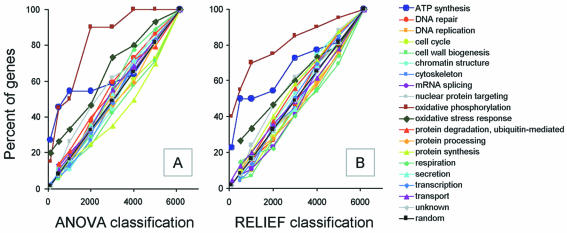
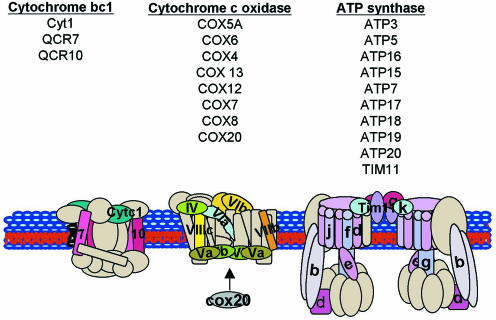
The accurate determination of the biological effects of low doses of pollutants is a major public health challenge. DNA microarrays are a powerful tool for investigating small intracellular changes. However, the inherent low reliability of this technique, the small number of replicates and the lack of suitable statistical methods for the analysis of such a large number of attributes (genes) impair accurate data interpretation. To overcome this problem, we combined results of two independent analysis methods (ANOVA and RELIEF). We applied this analysis protocol to compare gene expression patterns in Saccharomyces cerevisiae growing in the absence and continuous presence of varying low doses of radiation. Global distribution analysis highlights the importance of mitochondrial membrane functions in the response. We demonstrate that microarrays detect cellular changes induced by irradiation at doses that are 1000-fold lower than the minimal dose associated with mutagenic effects.


Figures

Figure 1
Figure 1
Comparison of the frequencies of recombination (A) and mutation (B) events induced by continuous irradiation at different dose rates. The recombinant frequency and the mutation frequency were measured as described in Materials and Methods for each independent culture exposed for 20 h to the dose rate of radiation indicated in Abcissa.
Figure 2
Figure 2
Scatter plots of relative differences in gene expression. Scatter plot of the genes as a function of their weight calculated with the RELIEF (A) or their P value calculated with ANOVA (B) are represented for experimental data (black) or random distribution of the experiments (dotted line). High scores represent significant difference in gene expression between I and NI samples. The random distribution was obtained by 1000 experimental permutations of the experimental data. The gray lines indicate the 95% confidence intervals of the random distribution.
Figure 3
Figure 3
Identification of the cellular processes affected. Genes were ranked by RELIEF (A) and by ANOVA (B) and grouped according to the cellular process involved. The ordinate corresponds to the percentage of genes involved in a given process with a rank below the value indicated on the abscissa.
Figure 4
Figure 4
Schematic diagram of the oxidative phosphorylation pathway. The proteins shown in cream were not induced by continuous exposure to ionizing radiation. The numbers indicate the names of the subunits in the protein complex. The names of the CIIR genes encoding the proteins in each complex are reported.
Figure 5
Figure 5
Analysis of the correlation between the ANOVA and RELIEF rankings as a function of the size of the gene set. The percentage of common genes was calculated for different numbers of top ranked genes (n, in abscissa) by ANOVA and RELIEF (diamonds). The percentage of ‘false’ common genes in two independent random drawings of size n was calculated by applying the hypergeometric law (circles). The difference between the two curves indicates the percentage of correlated top ranked genes between the ANOVA and RELIEF rankings (triangles).
Figure 6
Figure 6
Induction factors and repression factors as a function of dose rate. The factors were calculated for experiments with various doses as the mean value for expression ratio of the induced (black boxes) and repressed (gray boxes) CIIR genes. The mean value and variance of factors from several experiments are reported for each dose rate analyzed.

References

    1. DeRisi J.L., Iyer,V.R. and Brown,P.O. (1997) Exploring the metabolic and genetic control of gene expression on a genomic scale. Science, 278, 680–686. - PubMed
    1. Yale J. and Bohnert,H.J. (2001) Transcript expression in Saccharomyces cerevisiae at high salinity. J. Biol. Chem., 276, 15996–16007. - PubMed
    1. Ferea T.L., Botstein,D., Brown,P.O. and Rosenzweig,R.F. (1999) Systematic changes in gene expression patterns following adaptive evolution in yeast. Proc. Natl Acad. Sci. USA, 96, 9721–9726. - PMC - PubMed
    1. terLinde J.J., Liang,H., Davis,R.W., Steensma,H.Y., van Dijken,J.P. and Pronk,J.T. (1999) Genome-wide transcriptional analysis of aerobic and anaerobic chemostat cultures of Saccharomyces cerevisiae. J. Bacteriol., 181, 7409–7413. - PMC - PubMed
    1. Natarajan K., Meyer,M.R., Jackson,B.M., Slade,D., Roberts,C., Hinnebusch,A.G. and Marton,M.J. (2001) Transcriptional profiling shows that Gcn4p is a master regulator of gene expression during amino acid starvation in yeast. Mol. Cell. Biol., 21, 4347–4368. - PMC - PubMed

Publication types

MeSH terms

Substances