. 2004 Jan 13;32(1):e13.
doi: 10.1093/nar/gnh015.

Revised UV extinction coefficients for nucleoside-5'-monophosphates and unpaired DNA and RNA

Affiliations

Revised UV extinction coefficients for nucleoside-5'-monophosphates and unpaired DNA and RNA

Michael J Cavaluzzi et al. Nucleic Acids Res. .

Abstract

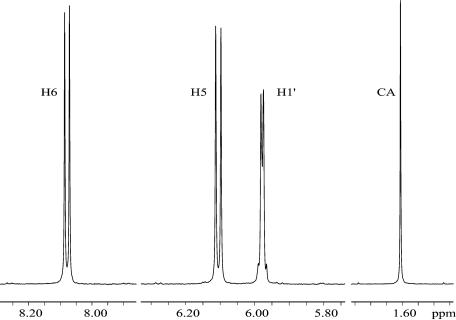
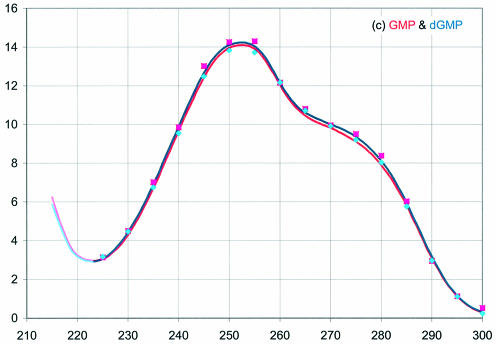
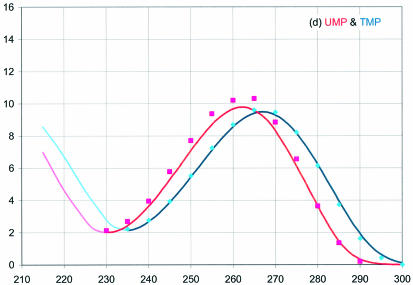
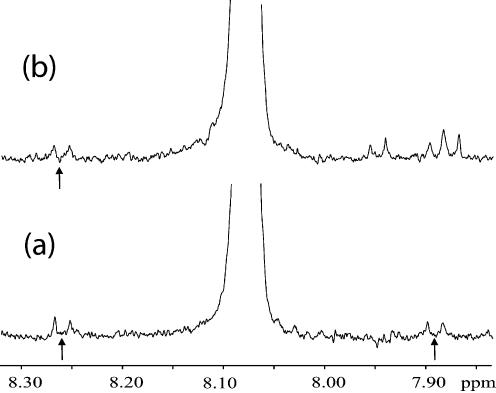
Ultraviolet absorption provides the nearly universal basis for determining concentrations of nucleic acids. Values for the UV extinction coefficients of DNA and RNA rely on the mononucleotide values determined 30-50 years ago. We show that nearly all of the previously published extinction coefficients for the nucleoside-5'-monophosphates are too large, and in error by as much as 7%. Concentrations based on complete hydrolysis and the older set of values are too low by approximately 4% for typical RNA and 2-3% for typical DNA samples. We also analyzed data in the literature for the extinction coefficients of unpaired DNA oligomers. Robust prediction of concentrations can be made using 38 microg/A260 unit for single-stranded DNA (ssDNA) having non-repetitive sequences and 40-80% GC. This is superior to currently used predictions that account for nearest-neighbor frequency or base composition. The latter result in concentrations that are 10-30% too low for typical ssDNA used as primers for PCR and other similar techniques. Methods are described here to accurately measure concentrations of nucleotides by nuclear magnetic resonance. NMR can be used to accurately determine concentrations (and extinction coefficients) of biomolecules within 1%.


Figures

Figure 1
Figure 1
500 MHz 1H NMR spectrum (0.5 Hz exponential broadening) for a D2O sample of 23.0 mM CMP and 19.6 mM cacodylic acid (CA). The CA peak is reduced in height by half (unapodized linewidth = 0.5 Hz). 13C-satellites are visible near the baseline.
Figure 2
Figure 2
UV absorbance of the RNA (red) and DNA (blue) 5′-mononucleotides, (a) A, (b) C, (c) G and (d) U and T. This work: dark lines right of the minimum near 230 nm. Squares: spectra from Beaven et al. (6) normalized to ε from Gray et al. (5). Diamonds: spectra from Voet et al. (7) normalized to ε from Gray et al. (5). Light lines at short wavelengths: data from Beaven et al. (6) and Voet et al. (7) normalized at the junction to spectra from this work.
Figure 2
Figure 2
UV absorbance of the RNA (red) and DNA (blue) 5′-mononucleotides, (a) A, (b) C, (c) G and (d) U and T. This work: dark lines right of the minimum near 230 nm. Squares: spectra from Beaven et al. (6) normalized to ε from Gray et al. (5). Diamonds: spectra from Voet et al. (7) normalized to ε from Gray et al. (5). Light lines at short wavelengths: data from Beaven et al. (6) and Voet et al. (7) normalized at the junction to spectra from this work.
Figure 3
Figure 3
13C-satellite (arrows) and impurity peaks surrounding the cytidylate–H6 doublet. (a) Spectrum shown in Figure 1. (b) Spectrum of a sample with impurity peaks overlaid upon the upfield satellite.
Figure 4
Figure 4
Deviations between measured and predicted extinction coefficients for 18 ssDNA oligomers. Closed symbols are for non-repetitive (complex) sequences, open symbols for repetitive (simple one- or two-base repeats). (a) Circles have ε260 = 10 ODU/µmol of monomer unit (33 µg/ODU); triangles, the weighted sum of mononucleotides; squares, nearest-neighbor estimation (14). (b) Circles have ε260 = 8.7 ODU/µmol (38 µg/ODU), and include the correction of Equation 2 for measurements (23,26) that are based on the monomer values of Warshaw (8), Warshaw and Tinoco (9) and Cantor et al. (10). (c) Percentage (A + G) was used to order the 18 DNA sequences. The vertical axis scale is the same for all panels

References

    1. Cavaluzzi M.J., Kerwood,D.J. and Borer,P.N. (2002) Accurate nucleic acid concentrations by nuclear magnetic resonance. Anal. Biochem., 308, 373–380. - PubMed
    1. Cavaluzzi M.J. (2003) PhD dissertation, Syracuse University, NY, USA.
    1. Lide D.R. (2002) Handbook of Chemistry and Physics. CRC Press, Boca Raton, FL, USA.
    1. Delaglio F., Grzesiek,S., Vuister,G.W., Zhu,G., Pfeifer,J. and Bax,A. (1995) NMRPipe: a multidimensional spectral processing system based on UNIX PIPES. J. Biomol. NMR, 6, 277–293. - PubMed
    1. Gray D.M., Ratliff,R.L. and Vaughan,M.R. (1992) Circular dichroism spectroscopy of DNA. Methods Enzymol., 211, 389–406. - PubMed

Publication types