

Virus-host cell interactions during hepatitis C virus RNA replication: impact of polyprotein expression on the cellular transcriptome and cell cycle association with viral RNA synthesis
- PMID: 14722306
- PMCID: PMC321413
- DOI: 10.1128/jvi.78.3.1513-1524.2004
Virus-host cell interactions during hepatitis C virus RNA replication: impact of polyprotein expression on the cellular transcriptome and cell cycle association with viral RNA synthesis
Abstract
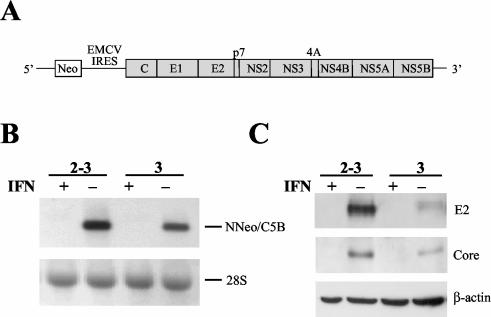
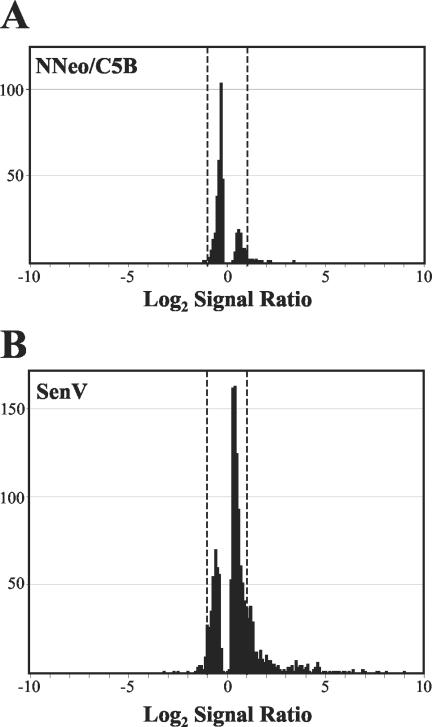
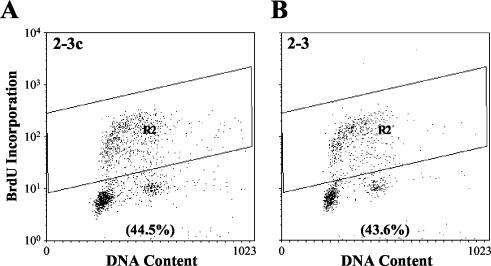
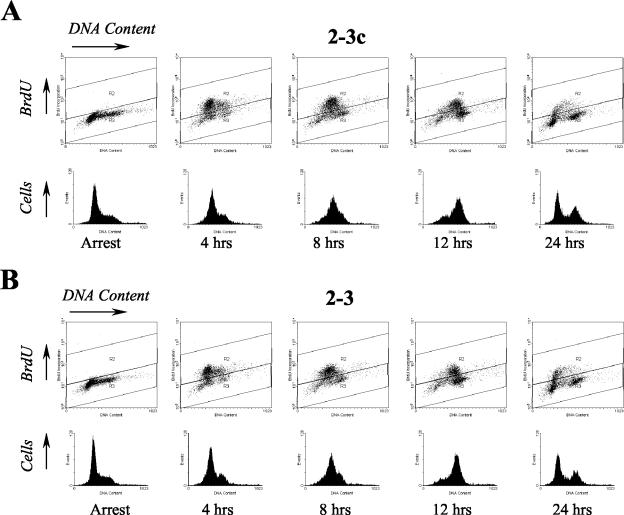
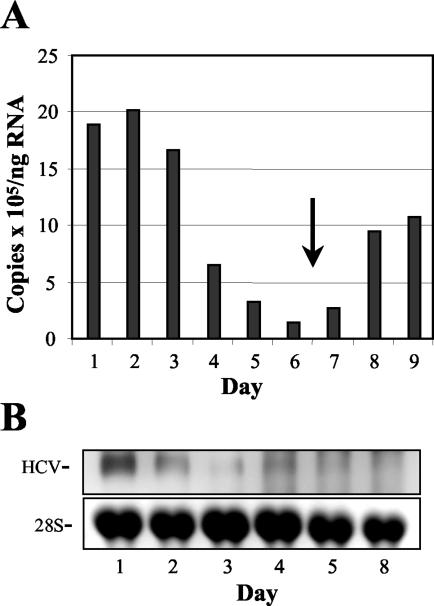
Considerable controversy surrounds the impact of hepatitis C virus (HCV) protein expression on viability of host cells and regulation of the cell cycle. Both promotion of cellular proliferation and apoptosis have been observed in different experimental systems. To determine whether expression of the entire complement of HCV proteins in the context of ongoing viral RNA replication significantly alters the host cell transcriptome and cell cycle regulatory processes, we carried out high-density oligonucleotide microarray studies and analyzed cell cycle distributions and S-phase entry in Huh7 cell clones harboring selectable, full-length, replicating HCV RNAs that express the entire genotype 1b, HCV-N polyprotein, and clonally related cells in which all viral RNA was eliminated by prior treatment with alpha interferon. Oligonucleotide microarray analyses revealed only subtle, coordinated differences in the mRNA profiles of cells containing replicating viral RNA and their interferon-cured progeny, with variation between different cell clones having a greater influence on the cellular transcriptome than the presence or absence of replicating HCV RNA. Flow cytometric analysis demonstrated no significant differences in cell cycle distribution among populations of asynchronously growing cells of both types. Cell lines containing replicating viral RNA and their interferon-cured progeny were able to reenter the cell cycle similarly after transient G(1) arrest. In contrast, although viral protein expression and genome replication did not alter cell cycle control in these cells, HCV genome replication was highly dependent on cellular proliferation, with viral RNA synthesis strongly decreased in poorly proliferating, confluent, or serum-starved cells and substantially enhanced in the S phase of the cell cycle.
Figures


Similar articles
-
Selectable subgenomic and genome-length dicistronic RNAs derived from an infectious molecular clone of the HCV-N strain of hepatitis C virus replicate efficiently in cultured Huh7 cells.J Virol. 2002 Mar;76(6):2997-3006. doi: 10.1128/jvi.76.6.2997-3006.2002. J Virol. 2002. PMID: 11861865 Free PMC article.
-
Identification of host genes showing differential expression profiles with cell-based long-term replication of hepatitis C virus RNA.Virus Res. 2012 Jul;167(1):74-85. doi: 10.1016/j.virusres.2012.04.008. Epub 2012 May 1. Virus Res. 2012. PMID: 22579597
-
Viral evolution and interferon resistance of hepatitis C virus RNA replication in a cell culture model.J Virol. 2004 Nov;78(21):11591-604. doi: 10.1128/JVI.78.21.11591-11604.2004. J Virol. 2004. PMID: 15479800 Free PMC article.
-
Hepatitis C virus RNA codes for proteins and replicates: does it also trigger the interferon response?Semin Liver Dis. 2000;20(1):57-68. doi: 10.1055/s-2000-9502. Semin Liver Dis. 2000. PMID: 10895432 Review.
-
Cutting the gordian knot-development and biological relevance of hepatitis C virus cell culture systems.Adv Virus Res. 2008;71:51-133. doi: 10.1016/S0065-3527(08)00002-X. Adv Virus Res. 2008. PMID: 18585527 Review.
Cited by
-
Effect of cell growth on hepatitis C virus (HCV) replication and a mechanism of cell confluence-based inhibition of HCV RNA and protein expression.J Virol. 2006 Feb;80(3):1181-90. doi: 10.1128/JVI.80.3.1181-1190.2006. J Virol. 2006. PMID: 16414995 Free PMC article.
-
Intracellular restriction of a productive noncytopathic coronavirus infection.J Virol. 2008 Jan;82(1):451-60. doi: 10.1128/JVI.01251-07. Epub 2007 Oct 24. J Virol. 2008. PMID: 17959675 Free PMC article.
-
Proteome analysis of liver cells expressing a full-length hepatitis C virus (HCV) replicon and biopsy specimens of posttransplantation liver from HCV-infected patients.J Virol. 2005 Jun;79(12):7558-69. doi: 10.1128/JVI.79.12.7558-7569.2005. J Virol. 2005. PMID: 15919910 Free PMC article.
-
Fatty acid synthase is up-regulated during hepatitis C virus infection and regulates hepatitis C virus entry and production.Hepatology. 2008 Nov;48(5):1396-403. doi: 10.1002/hep.22508. Hepatology. 2008. PMID: 18830996 Free PMC article.
-
DDX6 (Rck/p54) is required for efficient hepatitis C virus replication but not for internal ribosome entry site-directed translation.J Virol. 2010 Jul;84(13):6810-24. doi: 10.1128/JVI.00397-10. Epub 2010 Apr 14. J Virol. 2010. PMID: 20392846 Free PMC article.
References
-
- Alter, M. 1997. Epidemiology of hepatitis C. Hepatology 26:62S-65S. - PubMed
-
- Alter, M. J., D. Kruszon-Moran, O. V. Nainan, G. M. McQuillan, F. Gao, L. A. Moyer, R. A. Kaslow, and H. S. Margolis. 1999. The prevalence of hepatitis C virus infection in the United States, 1988 through 1994. N. Engl. J. Med. 341:556-562. - PubMed
-
- Arima, N., C. Y. Kao, T. Licht, R. Padmanabhan, and Y. Sasaguri. 2001. Modulation of cell growth by the hepatitis C virus nonstructural protein NS5A. J. Biol. Chem. 276:12675-12684. - PubMed
Publication types
MeSH terms
Substances
Grants and funding
LinkOut - more resources
Full Text Sources
Other Literature Sources
