. 2004 Jan;113(2):243-52.
doi: 10.1172/JCI18847.

Bone marrow-derived progenitor cells in pulmonary fibrosis

Affiliations

Bone marrow-derived progenitor cells in pulmonary fibrosis

Naozumi Hashimoto et al. J Clin Invest. 2004 Jan.

Abstract

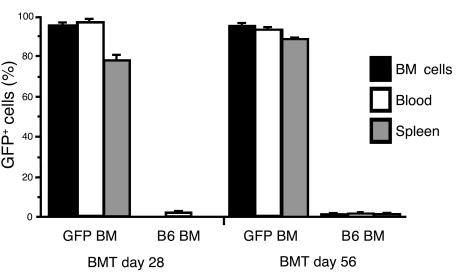
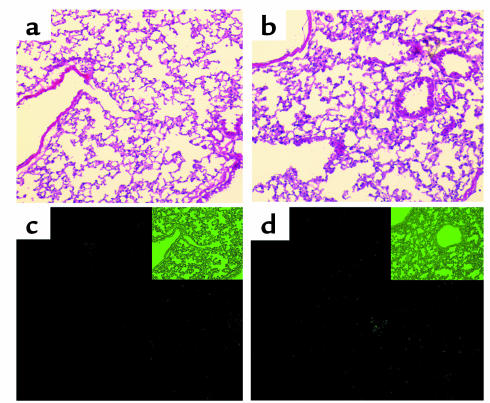
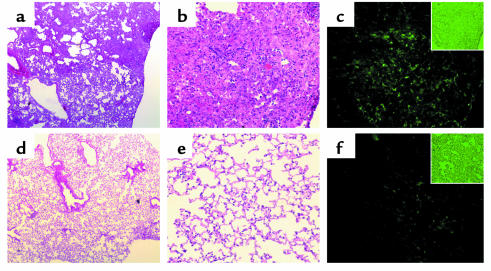
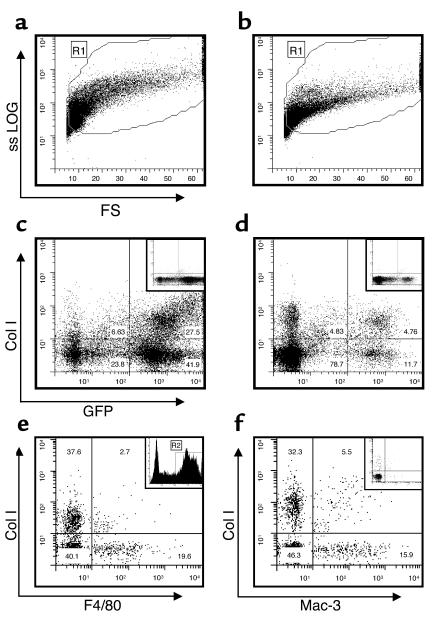
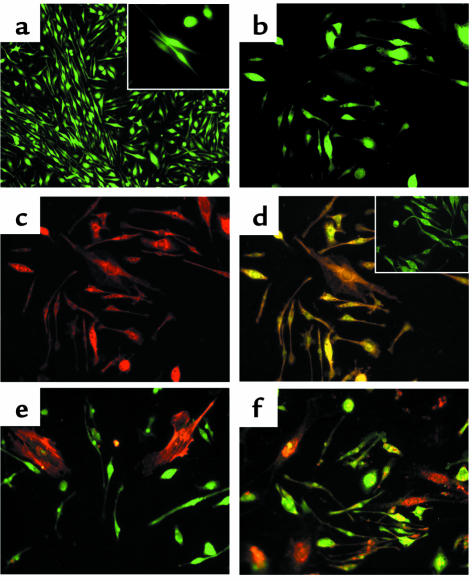
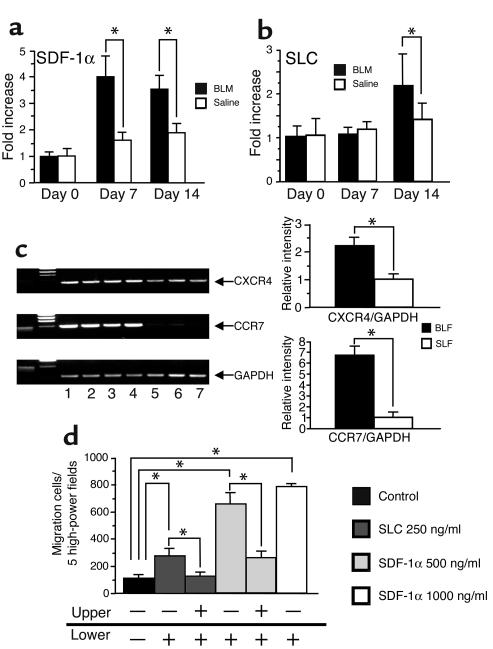
The origin of fibroblasts in pulmonary fibrosis is assumed to be intrapulmonary, but their extrapulmonary origin and especially derivation from bone marrow (BM) progenitor cells has not been ruled out. To examine this possibility directly, adult mice were durably engrafted with BM isolated from transgenic mice expressing enhanced GFP. Induction of pulmonary fibrosis in such chimera mice by endotracheal bleomycin (BLM) injection caused large numbers of GFP(+) cells to appear in active fibrotic lesions, while only a few GFP(+) cells could be identified in control lungs. Flow-cytometric analysis of lung cells confirmed the BLM-induced increase in GFP(+) cells in chimera mice and revealed a significant increase in GFP(+) cells that also express type I collagen. GFP(+) lung fibroblasts isolated from chimera mice expressed collagen and telomerase reverse transcriptase but not alpha-smooth muscle actin. Treatment of isolated GFP(+) fibroblasts with TGF-beta failed to induce myofibroblast differentiation. Cultured lung fibroblasts expressed the chemokine receptors CXCR4 and CCR7 and responded chemotactically to their cognate ligands, stromal cell-derived factor-1 alpha and secondary lymphoid chemokine, respectively. Thus the collagen-producing lung fibroblasts in pulmonary fibrosis can also be derived from BM progenitor cells.


Figures

Figure 1
Figure 1
Kinetics of engraftment of GFP+ BM cells. BM, peripheral blood, and spleen from recipient mice were collected at days 28 and 56 after transplantation with BM from GFP Tg mice. The nucleated cells from these samples were immunostained with biotin-conjugated anti–mouse CD45.2 and then detected by subsequent staining with SAv-Cy-Chrome. The percentage of GFP+ cells among CD45.2+ cells in these samples were determined by flow cytometry. Data shown represent the means ± SEM from groups of 6–12 BM chimera mice.
Figure 2
Figure 2
Lung morphology of BM chimera mice. Representative lung sections from GFP BM chimera mice were examined on day 28 (a and c) and day 56 (b and d) after BMT, by light microscopy (a and b, H&E-stained sections) and fluorescence microscopy (c and d). At day 28 after BMT (a), lungs from GFP BM chimera mice revealed essentially normal lung architecture and no evidence of pneumonitis. At day 56 after BMT (b), the lungs also appeared essentially normal, except for a few scattered inflammatory cells. Only a few GFP+ cells were present in lung sections on both days 28 (c) and 56 (d) after BMT. Insets in c and d showed light-microscopic images of the unstained sections used for fluorescence microscopy. All images were photographed at ×100.
Figure 3
Figure 3
Morphology of BLM-induced lung fibrosis in BM chimera mice. Representative lung sections from BLM-treated (ac) or saline-treated (df) GFP BM chimera mice were evaluated at day 28 after BLM or saline treatment. The H&E-stained sections revealed severe distortion of lung alveolar architecture due to extensive fibrosis (a and b, at ×40 and ×200, respectively). (c) Numerous GFP+ cells in densely cellular fibrotic lesions were easily identifiable by fluorescence microscopy in BLM-treated lungs. ×200. In contrast, H&E-stained lung sections from saline-treated GFP BM chimera mice showed normal lung architecture (d and e, at ×40 and ×200, respectively), with a few scattered GFP+ cells visualized by fluorescence microscopy (f, at ×200). Insets in c and f showed the light-microscopic appearance of the respective sections examined by fluorescence microscopy. ×200.
Figure 4
Figure 4
Flow-cytometric analysis of whole-lung cells from GFP BM chimera mice. Whole-lung cells were isolated from BLM-treated (a and c) or saline-treated (b and d) GFP BM chimera mice at day 21 after BLM or saline treatment. Following the appropriate immunostaining, the cells were analyzed by flow cytometry for GFP and Col I expression (c and d) after gating on intact live cells (region indicated by R1) according to side scatter (shown in logarithmic scale, ssLOG) and forward scatter (FS) (a and b). Results of analysis of cells treated with isotype-matched control IgG for the anti–Col I antibody are shown in the insets in c and d. Furthermore, the GFP+ cells from these BLM-treated mice were analyzed for Col I and F4/80 or Mac-3 expression after gating on GFP+ cells in the R1 region (region indicated by R2 in the inset in e) (e and f). The Col I+ and F4/80+ cells represented 2.7% ± 0.76% of GFP+ cells (e). The Col I+ and Mac-3+ cells represented 5.5% ± 0.4% of GFP+ cells (f). Inset in f shows the cells stained with isotype-matched control IgG. Representative runs are shown for each group from a total of eight BLM-treated or saline-treated GFP BM chimera mice, respectively. The quantitative results are summarized in Table 1.
Figure 5
Figure 5
Characterization of cultured lung fibroblasts. Lung fibroblasts isolated from BLM-treated GFP BM chimera mice were analyzed by fluorescence microscopy (af). The cells showed typical fibroblast morphology, many being stellate or spindle-shaped (a). An average 80% of these cells expressed GFP (green fluorescence in a, at ×100; inset at ×400). Cells were stained with both anti-GFP (green) and anti–Col I (red) antibodies in bd. The same microscopic field was photographed with the green (b) or red (c) filter only, or both simultaneously (d). Colocalization of both GFP and Col I expression resulted in a yellow color in d. Inset in d shows the cells stained with anti-GFP antibody (green) and isotype-matched control IgG for Col I (red). Cells were also stained with both anti-GFP (green) and anti–α-SMA (red) antibodies (e). Colocalization of GFP and α-SMA should appear yellow, but the two α-SMA+ cells in this field did not appear to express GFP (e). Finally, cells were also stained with anti-GFP (green) and anti-TERT (red) antibodies. Colocalization of GFP and TERT appeared yellow, and most of the cells in this field expressed both TERT and GFP (f). Magnification was ×200 for bf. A representative example of at least three independent experiments is shown.
Figure 6
Figure 6
Chemokine and chemokine receptor expression, and fibroblast migration. Lung RNA from saline-treated or BLM-treated mice were obtained at the indicated time points (days after saline or BLM treatment, with day 0 indicating pretreatment values) and analyzed for SDF-1α (a) and SLC (b) mRNA using real-time PCR. Data shown at each time point represent the means ± SD from six BLM-treated or saline-treated mice, respectively, and are representative of two independent experiments. (c) Results of RT-PCR analysis for CXCR4 and CCR7 mRNA in cultured BLF or SLF. The left panel in c shows a representative electropherogram of the indicated products using RNA samples from: spleen (lane 1), BLF (lanes 2–4), and SLF (lanes 5–7). The right panel in c summarizes the quantitative results after normalization to the GAPDH signal. Data shown represent the means ± SD (n = 3), and are representative of three independent experiments. BLF were analyzed for migratory activity toward the indicated chemokine (d). Additions to the upper (where cells were loaded) or lower chamber were as indicated. Both SLC and SDF-1α were chemotactic for lung fibroblasts, and SDF-1α was also weakly chemokinetic. Data shown represent means ± SD. The experiment was repeated once with similar results. Asterisks signify statistically significant difference (P < 0.05) between the two groups indicated by connecting lines above the respective bars.

Comment in

References

    1. Blau HM, Brazelton TR, Weimann JM. The evolving concept of a stem cell: entity or function? Cell. 2001;105:829–841. - PubMed
    1. Ferrari G, et al. Muscle regeneration by bone marrow-derived myogenic progenitors. Science. 1998;279:1528–1530. - PubMed
    1. Orlic D, et al. Bone marrow cells regenerate infarcted myocardium. Nature. 2001;410:701–705. - PubMed
    1. Lagasse E, et al. Purified hematopoietic stem cells can differentiate into hepatocytes in vivo. Nat. Med. 2000;6:1229–1234. - PubMed
    1. Krause DS, et al. Multi-organ, multi-lineage engraftment by a single bone marrow-derived stem cell. Cell. 2001;105:369–377. - PubMed

Publication types

MeSH terms