. 2004 Jan;113(2):253-64.
doi: 10.1172/JCI16269.

Impaired Smad7-Smurf-mediated negative regulation of TGF-beta signaling in scleroderma fibroblasts

Affiliations

Impaired Smad7-Smurf-mediated negative regulation of TGF-beta signaling in scleroderma fibroblasts

Yoshihide Asano et al. J Clin Invest. 2004 Jan.

Abstract

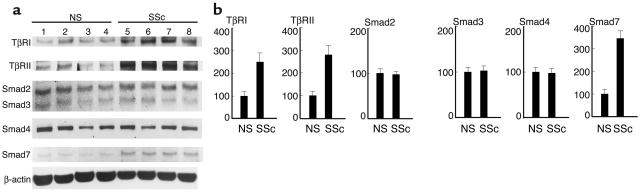
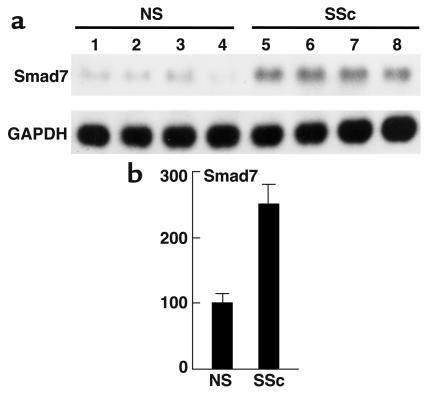
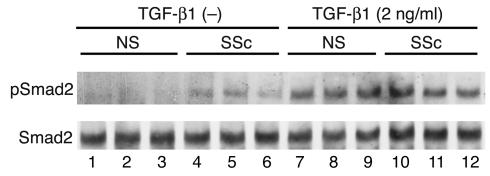
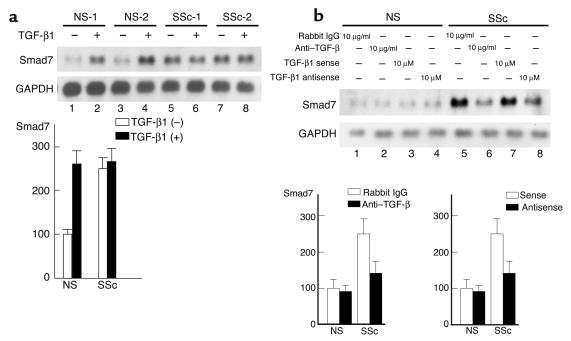
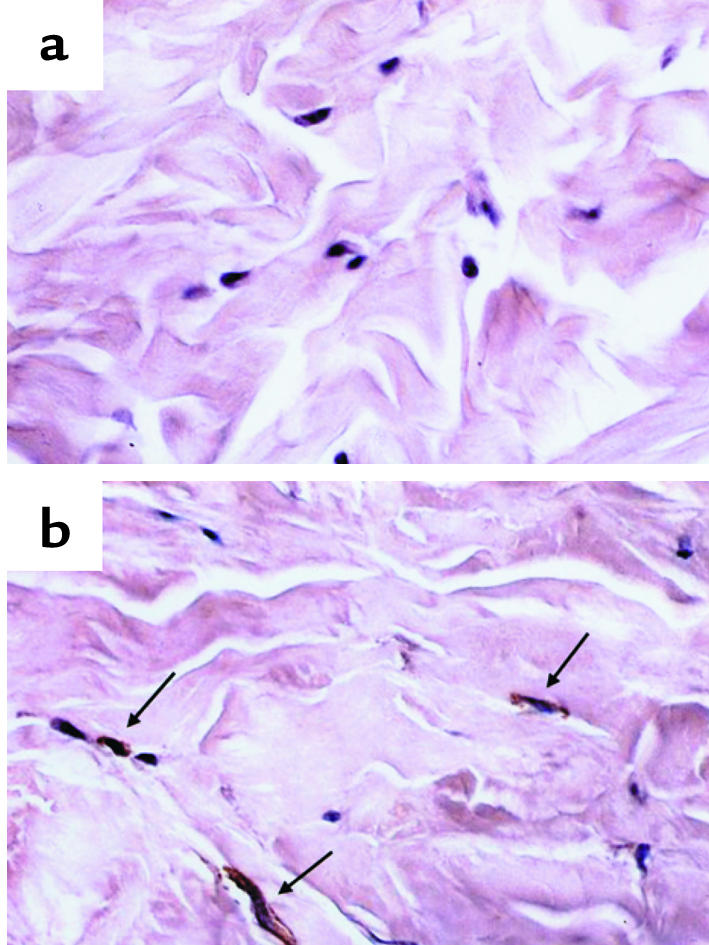
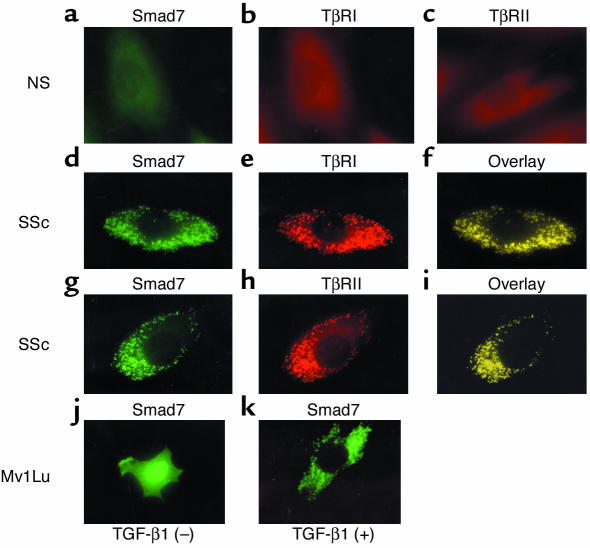
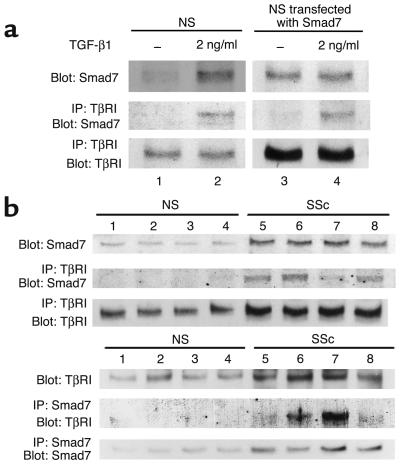
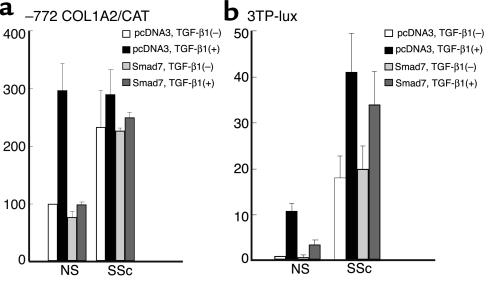
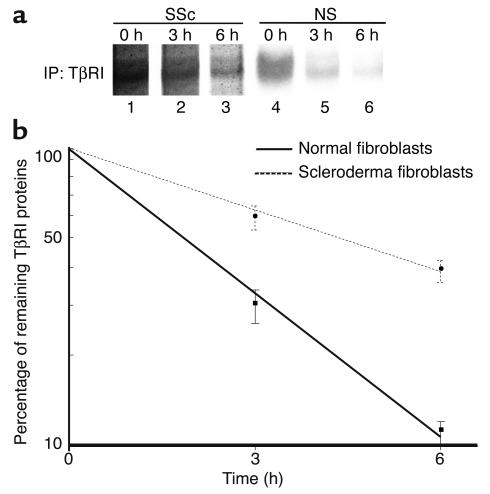
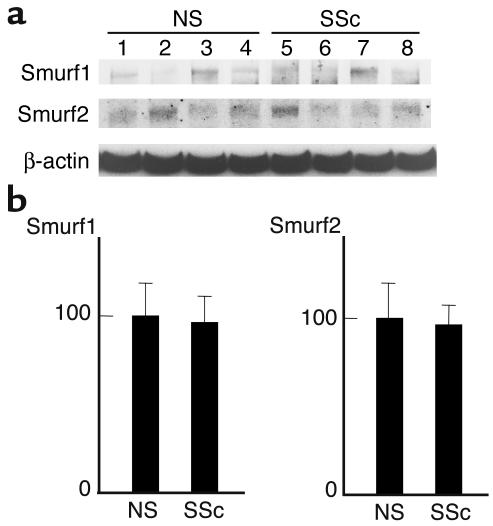
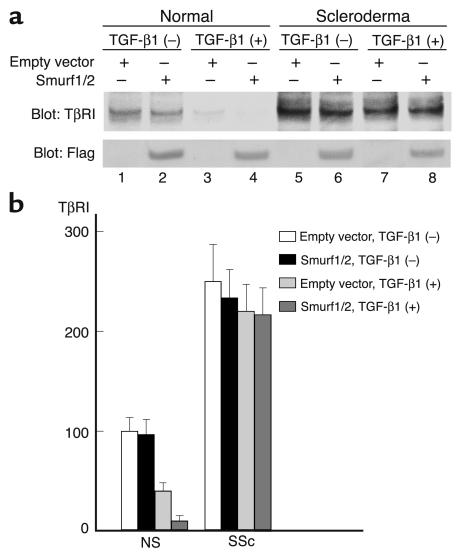
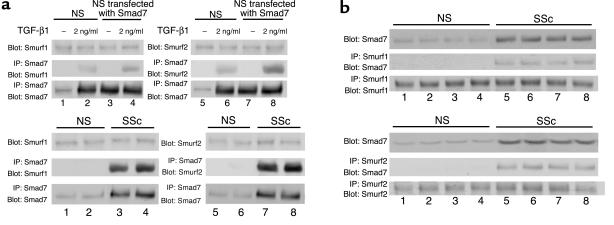
The principal effect of TGF-beta1 on mesenchymal cells is its stimulation of ECM synthesis. Previous reports indicated the significance of the autocrine TGF-beta loop in the pathogenesis of scleroderma. In this study, we focused on Smad7 and Smurfs, principal molecules in the negative regulation of TGF-beta signaling, to further understand the autocrine TGF-beta loop in scleroderma. Scleroderma fibroblasts exhibited increased Smad7 levels compared with normal fibroblasts in vivo and in vitro. Smad7 constitutively formed a complex with the TGF-beta receptors, and the inhibitory effect of Smad7 on the promoter activity of human alpha2(I) collagen and 3TP-lux was completely impaired in scleroderma fibroblasts. Furthermore, the protein stability of TGF-beta receptor type I was significantly increased in scleroderma fibroblasts compared with normal fibroblasts. There was no significant difference in Smurf1 and Smurf2 levels between normal and scleroderma fibroblasts, and the transiently overexpressed Smurf1 and/or Smurf2 did not affect TGF-beta receptor type I protein levels in scleroderma fibroblasts. These results indicate that the impaired Smad7-Smurf-mediated inhibitory effect on TGF-beta signaling might contribute to maintaining the autocrine TGF-beta loop in scleroderma fibroblasts. To our knowledge, this is the first report of a disturbed negative regulation of TGF-beta signaling in fibrotic disorders.


Figures

Figure 1
Figure 1
Expression levels of TβRI, TβRII, Smad2, Smad3, Smad4, and Smad7 in normal and scleroderma fibroblasts. (a) Whole-cell lysates were electrophoresed through a 10% polyacrylamide gel, transferred to a nitrocellulose membrane, and probed with the indicated Ab’s. One representative of five independent experiments is shown. (b) The protein levels quantitated by scanning densitometry are shown relative to those in normal fibroblasts (100 arbitrary units [AU]). Data are expressed as the mean ± SD of five independent experiments. NS, normal skin fibroblasts; SSc, scleroderma fibroblasts.
Figure 2
Figure 2
Comparison of the Smad7 mRNA levels between normal and scleroderma fibroblasts. Northern blot analysis of Smad7 mRNA was performed using 2 μg of Poly(A)+ RNA. Levels of GAPDH mRNA are shown as a loading control. One representative of five independent experiments is shown (a). Smad7 mRNA levels quantitated by scanning densitometry and corrected for the level of GAPDH in the same samples are shown relative to those in normal fibroblasts (100 AU) (b). Data are expressed as the mean ± SD of five independent experiments.
Figure 3
Figure 3
The phosphorylation levels of Smad2 in normal and scleroderma fibroblasts either treated or untreated [TGF-β1 (–)] with TGF-β1. Cell extracts were prepared from confluent quiescent fibroblasts either treated or untreated with 2 ng/ml of TGF-β1 for 1 hour, electrophoresed through a 10% polyacrylamide gel, transferred to a nitrocellulose membrane, and probed with anti–phospho-Smad2 Ab (pSmad2). After stripping, total levels of Smad2 were determined using anti-Smad2/Smad3 Ab. One representative of five independent experiments is shown.
Figure 4
Figure 4
Effects of TGF-β1 stimulation, anti–TGF-β Ab, or TGF-β1 antisense oligonucleotide on Smad7 mRNA expression in normal and scleroderma fibroblasts. (a) Smad7 mRNA levels in normal and scleroderma fibroblasts treated or untreated with TGF-β1 (2 ng/ml) for 3 hours were investigated by Northern blot analysis. Representative results are shown (upper panels). Smad7 mRNA levels quantitated by scanning densitometry and corrected for the level of GAPDH in the same samples are shown relative to those in normal fibroblasts without TGF-β1 stimulation (100 AU) (lower panel). Data are expressed as the mean ± SD of five independent experiments. (b) Cells were treated with the indicated reagent for 48 hours, and Smad7 mRNA levels were investigated by Northern blot analysis. Representative results are shown (upper panels). Smad7 mRNA levels quantitated by scanning densitometry and corrected for the level of GAPDH in the same samples are shown relative to those in normal fibroblasts (100 AU) (lower panels). Data are expressed as the mean ± SD of five independent experiments.
Figure 5
Figure 5
Expression levels of Smad7 in normal and scleroderma dermal tissue. Paraffin sections of normal dermal tissue (a) and scleroderma dermal tissue (b) were subjected to immunohistochemical analysis with anti-Smad7 Ab, as described in Methods. The immunoreactivity for Smad7 is indicated by arrows.
Figure 6
Figure 6
Subcellular localization of Smad7 in normal and scleroderma fibroblasts. (ai) The subcellular distribution of Smad7, TβRI, and TβRII was visualized by immunofluorescence. Smad7 was visualized with polyclonal goat anti-Smad7 Ab and FITC-conjugated donkey anti-goat IgG (green). TβRI and TβRII were detected with polyclonal rabbit anti-TβRI and TβRII Ab’s and TRITC-conjugated donkey anti-rabbit IgG (red), respectively. Colocalization of Smad7 and TGF-β receptors (overlay) appears as yellow. (j and k) Mv1Lu cells were transfected with the expression vector for Smad7. After a 48-hour incubation, Smad7 was visualized as described above (j). In some experiments, cells were treated with TGF-β1 (2 ng/ml) for the last 3 hours (k).
Figure 7
Figure 7
Constitutive complex formation of Smad7 with TβRI in scleroderma fibroblasts. (a) In the left panels, confluent quiescent normal fibroblasts were incubated in the absence or presence of TGF-β1 (2 ng/ml) for 24 hours. In the right panels, normal fibroblasts were transfected with the Smad7 expression vector (2 μg) and incubated for 48 hours prior to cell extraction. Some transfectants were stimulated with TGF-β1 (2 ng/ml) for the last 3 hours. Cell lysates (1 mg of protein/sample) were subjected to immunoprecipitation (IP) using anti-TβRI Ab. Immunoprecipitates were subjected to immunoblotting (Blot) using anti-Smad7 Ab. After stripping, total TβRI levels were determined by immunoblotting. Total Smad7 levels were determined by immunoblotting using whole-cell lysates (20 μg of protein/sample). (b) Cell lysates prepared from confluent quiescent fibroblasts were subjected to immunoprecipitation and immunoblotting as described above (upper panels). Reverse immunoprecipitation using anti-Smad7 Ab was also performed (lower panels). Each figure shows one representative of five independent experiments.
Figure 8
Figure 8
The inhibitory effect of Smad7 in normal and scleroderma fibroblasts. Cells were transfected with 2 μg of the –772COL1A2/CAT (a) or 3TP-lux construct (b), along with 0.1 μg of Smad7 or the corresponding empty construct. After a 24-hour incubation, the indicated reagent was added. Cells were harvested 48 hours after transfection. Values represent the promoter activity relative to that of untreated normal fibroblasts transfected with empty vector, which was set at 100 (a) or 10 AU (b). The mean and SEM results from five separate experiments are shown.
Figure 9
Figure 9
Comparison of the stability of TβRI protein between normal and scleroderma fibroblasts. Cells were incubated in cysteine- and methionine-free MEM for 30 minutes and then pulsed in the same medium containing [35S]cysteine and [35S]methionine (1 mCi/ml) for 30 minutes. Pulse-labeled cells were chased for 0, 3, or 6 hours in serum-free medium. Cell extracts (1 μg) were subjected to immunoprecipitation using anti-TβRI Ab, and immunoprecipitates (IP) were analyzed by SDS-PAGE and autoradiography. One representative of five independent experiments is shown (a). The densities of bands were measured with a densitometer, and the protein half-life was calculated as described in Methods. The mean and SEM from five separate experiments are shown (b).
Figure 10
Figure 10
Comparison of the expression levels of Smurfs between normal and scleroderma fibroblasts. Cell lysates prepared from confluent quiescent fibroblasts were subjected to immunoblotting using the indicated Ab’s. One representative of five independent experiments is shown (a). The protein levels quantitated by scanning densitometry are shown relative to those in normal fibroblasts (100 AU) (b). Data are expressed as the mean ± SD of five independent experiments.
Figure 11
Figure 11
The effect of the transient overexpression of Smurf1/Smurf2 on the levels of TβRI protein in normal and scleroderma fibroblasts. Cells were transfected with 1 μg each of the Smurf1 and Smurf2 expression vectors or the corresponding empty constructs. After a 48-hour incubation, the levels of TβRI or exogenous overexpressed Smurf1/Smurf2 were determined by Western blot analysis using anti-TβRI Ab or anti-Flag Ab, respectively. In some experiments, cells were treated with TGF-β1 (2 μg/ml) for the last 24 hours. One representative of five independent experiments is shown (a). The protein levels quantitated by scanning densitometry are shown relative to those in untreated normal fibroblasts transfected with empty vector (100 AU) (b). Data are expressed as the mean ± SD of five independent experiments.
Figure 12
Figure 12
Smad7 can interact with Smurfs in scleroderma fibroblasts. (a) Whole-cell lysates (1 mg of protein/sample) prepared from confluent quiescent normal fibroblasts or normal fibroblasts transfected with the Smad7 expression vector were subjected to immunoprecipitation using anti-Smad7 Ab. In some experiments, cells were stimulated with TGF-β1 (2 ng/ml) for 3 hours. Immunoprecipitates were subjected to immunoblotting using anti-Smurf1 Ab (left panels) or anti-Smurf2 Ab (right panels). After stripping, total Smad7 levels were determined by immunoblotting. Total Smurf1 or Smurf2 levels were determined by immunoblotting using whole-cell lysates (20 μg protein/sample). The same experiments were performed using whole-cell lysates prepared from normal and scleroderma fibroblasts (lower panels). (b) Reverse immunoprecipitation using anti-Smurf1 Ab (upper panels) or anti-Smurf2 Ab (lower panels) was performed.

References

    1. LeRoy, E.C. 1992. Systemic sclerosis (scleroderma). In Cecil text book of medicine. 19th edition. J.B. Wyngaarden, L.H. Smith, and J.C. Bennett, editors. WB Saunders. Philadelphia, Pennsylvania, USA. 1530–1535.
    1. Korn JH. Immunologic aspects of scleroderma. Curr. Opin. Rheumatol. 1989;1:479–484. - PubMed
    1. Mauch C, Krieg T. Fibroblast-matrix interactions and their role in the pathogenesis of fibrosis. Rheum. Dis. Clin. North. Am. 1990;16:93–107. - PubMed
    1. Jelaska A, Arakawa M, Broketa G, Korn JH. Heterogeneity of collagen synthesis in normal and systemic sclerosis skin fibroblasts: increased proportion of high collagen-producing cells in systemic sclerosis fibroblasts. Arthritis Rheum. 1996;39:1338–1346. - PubMed
    1. Mauch C, Kozlowska E, Eckes B, Krieg T. Altered regulation of collagen metabolism in scleroderma fibroblasts grown within three-dimensional collagen gels. Exp. Dermatol. 1992;1:185–190. - PubMed

Publication types

MeSH terms