. 2004 Apr 15;556(Pt 2):601-22.
doi: 10.1113/jphysiol.2003.053132. Epub 2004 Jan 14.

Sub- and suprathreshold receptive field properties of pyramidal neurones in layers 5A and 5B of rat somatosensory barrel cortex

Affiliations

Sub- and suprathreshold receptive field properties of pyramidal neurones in layers 5A and 5B of rat somatosensory barrel cortex

Ian D Manns et al. J Physiol. .

Abstract

Layer 5 (L5) pyramidal neurones constitute a major sub- and intracortical output of the somatosensory cortex. This layer 5 is segregated into layers 5A and 5B which receive and distribute relatively independent afferent and efferent pathways. We performed in vivo whole-cell recordings from L5 neurones of the somatosensory (barrel) cortex of urethane-anaesthetized rats (aged 27-31 days). By delivering 6 deg single whisker deflections, whisker pad receptive fields were mapped for 16 L5A and 11 L5B neurones located below the layer 4 whisker-barrels. Average resting membrane potentials were -75.6 +/- 1.1 mV, and spontaneous action potential (AP) rates were 0.54 +/- 0.14 APs s(-1). Principal whisker (PW) evoked responses were similar in L5A and L5B neurones, with an average 5.0 +/- 0.6 mV postsynaptic potential (PSP) and 0.12 +/- 0.03 APs per stimulus. The layer 5A sub- and suprathreshold receptive fields (RFs) were more confined to the principle whisker than those of layer 5B. The basal dendritic arbors of layer 5A and 5B cells were located below both layer 4 barrels and septa, and the cell bodies were biased towards the barrel walls. Responses in both L5A and L5B developed slowly, with onset latencies of 10.1 +/- 0.5 ms and peak latencies of 33.9 +/- 3.3 ms. Contralateral multi-whisker stimulation evoked PSPs similar in amplitude to those of PW deflections; whereas, ipsilateral stimulation evoked smaller and longer latency PSPs. We conclude that in L5 a whisker deflection is represented in two ways: focally by L5A pyramids and more diffusely by L5B pyramids as a result of combining different inputs from lemniscal and paralemniscal pathways. The relevant output evoked by a whisker deflection could be the ensemble activity in the anatomically defined cortical modules associated with a single or a few barrel-columns.


Figures
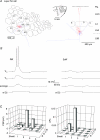
Figure 1
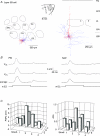
Figure 1. Sensory responses and anatomy of a layer 5A (L5A) somatosensory pyramidal neurone
A, the rat's whisker pad, represented in the centre, provides reference for the whiskers' corresponding cortical barrels shown in the left and right panels. Dendritic (red) and axonal (blue) arborizations of the recorded neurone across the barrel cortex viewed from tangential (centre) and coronal (right) perspectives. From the coronal view, the cell body resides in L5A. B, whisker stimulation (w) evoked membrane potential (Vm) responses in D2 principle (PW) and D3 surround whiskers (SuW). The average membrane potential responses are shown in the lower traces. The time course of the whisker deflection is shown below the averages. C, subthreshold (left) and suprathreshold (right) receptive fields (RFs). The height of each bar represents the average postsynaptic potential (PSP) or number of action potentials (APs) evoked by each stimulus for the respective whiskers of the whisker pad (Stradl. refers to the straddler whiskers).
Figure 2
Figure 2. Sensory responses and anatomy of a L5B somatosensory pyramidal neurone
A, the rat's whisker pad, represented in the centre, provides reference for the whiskers' corresponding cortical barrels shown in the left and right panels. Dendritic (red) and axonal (blue) arborizations of the recorded neurone across the barrel cortex viewed from tangential (centre) and coronal (right) perspectives. From the coronal view, the cell body resides in L5B. B, whisker stimulation (w) evoked membrane potential (Vm) responses in E2 principle (PW) and D2 surround whiskers (SuW). The average membrane potential responses are shown in the lower traces. The time course of the whisker deflection is shown below the averages. C, subthreshold (left) and suprathreshold (right) receptive fields (RFs). The height of each bar represents the average postsynaptic potential (PSP) or number of action potentials (APs) evoked by each stimulus for the respective whiskers of the whisker pad (Stradl. refers to the straddler whiskers).
Figure 3
Figure 3. Subthreshold RF map and dendritic and axonal segment density plots of L5A neurones
A1, average normalized subthreshold RF map for L5A cells (n = 15); note that it is offset to match the area of maximal dendritic density in B. The black grid indicates whisker positions, given with respect to the PW. Whisker positions are given by intersection of horizontal and vertical lines. The ordinate −2 refers to the caudally located SuWs in the second arc posterior to the PW. Similarly, the ordinate +2 refers to the rostrally located SuWs in the second arc anterior to the PW. On the abscissa ‘dorsal’ indicates whisker positions above the PW, and ‘ventral’ whisker positions below the PW. The response amplitude is indicated by the brightness normalized to the peak of the PW deflection amplitude determined in each experiment. The black contour line delineates an area on the RF map responding with ∼50% of the PW peak response amplitude. An average cytoarchitectonic L4 barrel field pattern (white, dashed lines) in the horizontal plane is superimposed for comparison of the average RF structure. Outlines above the PW barrel correspond to barrels located laterally. Outlines to the right of PW barrel outline correspond to barrels located anterior to the PW barrel. A2, average normalized suprathreshold RF map for L5A cells. The conventions are the same as in A1. B, average 2-D map of dendritic length density (red, n = 6) projected on to the tangential horizontal plane. The average barrel field is superimposed (white, dashed lines) for comparison as in A. The inner white contour line delineates an area that contains densities that are ∼50% of the maximal density of dendrite segments. The outer white contour line delineates an area that includes 80% of all dendrite segments. C, average 2-D map of axon ‘length density’ (blue, n = 6) projected on to the tangential horizontal plane as in B. D, average 2-D map of dendritic length density (red, n = 16) projected on to the coronal vertical plane along the barrel arcs. The dashed lines represent outlines of averaged barrels: centre, PW barrel; right, lateral barrel; left, medial barrel. The dashed line below the barrels demarcates the L5A/L5B transition, while the continuous white line above represents the cortical surface. The contours are the ∼50% maximal density, and 80% of all segments as in B. E, average 2-D map of axon length density (blue, n = 15). Projection onto the coronal vertical plane as in D.
Figure 4
Figure 4. Subthreshold RF map and dendritic and axonal segment density plots of L5B neurones
A1, average normalized subthreshold RF map for L5B cells (n = 11). All conventions are the same as for Fig. 3A. A2, average normalized suprathreshold RF map for L5B cells. The conventions are the same as for Fig. 3A1. B, average 2-D map of dendritic length density (red, n = 4) projected on to the tangential horizontal plane; conventions as for Fig. 3B. C, average 2-D map of axon ‘length density’ (blue, n = 4) projected on to the tangential horizontal plane as in B. D, average 2-D map of dendritic length density (red, n = 11) projected on to the coronal vertical plane along the barrel arcs; conventions as for Fig. 3D. E, average 2-D map of axon length density (blue, n = 11). Projection on to the coronal vertical plane as in D.
Figure 5
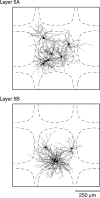
Figure 5. Distribution L5A (n = 6) and L5B (n = 4) reconstructed cells from tangential sections superimposed on an idealized barrel
Whisker-barrel conventions the same as Fig. 4. Note the positioning of most cells proximal to the barrel/septum border and the extension of dendrites into septa and neighbouring barrels.
Figure 6
Figure 6. Sub- and suprathreshold receptive fields of layers 5A and 5B somatosensory cells
A, subthreshold averaged RF maps for L5A (n = 15) and L5B (n = 11) neurones, centred to their principle whisker, with bar height indicating average PSP evoked per whisker deflection. B, suprathreshold average RF maps, with bar height indicating average number of spikes evoked (APs) per whisker deflection.
Figure 7
Figure 7. Anatomy and subthreshold receptive fields of a pair of anatomically clustered L5A and L5B somatosensory pyramidal neurones recorded and labelled in succession
A, dendritic (black) and axonal (green) arborizations of the L5A neurone and the dendritic (red) and axonal (blue) arborizations of the L5B neurone are viewed from the coronal perspectives. B, subthreshold receptive fields (RFs) for the L5A and L5B cells. The height each bar represents the average postsynaptic potential (PSP) evoked by the stimulation of respective whiskers of the whisker pad (Stradl. refers to the stradler whiskers). D3 whisker stimulation evoked the greatest excitation in both the L5A and the L5B cell.
Figure 8
Figure 8. Average membrane potential changes evoked by deflection of principle (PW), primary (Su1W) and secondary (Su2W) surround whiskers
A, average PSPs for L5A neurones (n= 16). B, onset of L5A responses at higher temporal resolution. C, average PSPs for L5B neurones (n = 11). D, onset of L5B responses at higher temporal resolution.
Figure 9
Figure 9. Time dependence of subthreshold RF structure; temporal evolution of the subthreshold responses in L5A and L5B
The grid of white lines indicates the whisker stimulated relative to the PW, in the centre, and the respective barrels, which are superimposed in the 10 ms panel. SuW amplitudes were normalized to the PW PSP maxima. Top and bottom panels show the averaged subthreshold RFs of L5A (n = 16) and 5B (n = 11) cells, respectively, at different times ranging from 10 to 160 ms following onset of whisker stimulation; note that these are offset to match the area of maximal dendritic L5A and L5B dendritic density from Figs 3B and 4B. The white lines delineate the areas equal to 80% and 50% of the maximal PW response.
Figure 10
Figure 10. Suprathreshold responses to PW stimulation
A, superimposed traces of responses of a L5A cell to PW deflections show two instances of action potentials. B, peristimulus time histograms (PSTHs, bin width 2 ms) for L5A cells over 20 trials, in relation to the principle whisker deflection shown above. The asterix indicates the PSTH of the cell shown in A. C, superimposed traces of a frequently firing L5B cell in response to whisker stimulation. D, PSTHs for L5B cells over 20 trials. The asterix indicates the PSTH of the cell in C. E, the average PSTH of L5A/L5B whisker-evoked spikes.
Figure 11
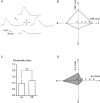
Figure 11. Responses to stimuli of different directions
A, average PSPs of a L5B cell when the PW was deflected in four directions. B, the average subthreshold responses of the illustrated cell: backwards (B), forwards (F), upwards (U), and downwards (D). C, the directionality index of L5A and L5B cells. Values of 1 would represent completely directional responses, while values of 0 would represent completely non-directional responses. Error bars represent s.e.m. D, direction preference of all recorded cells.
Figure 12
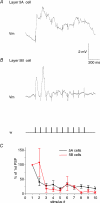
Figure 12. Responses to repetitive PW stimulation
Stimuli were brief deflections applied at 10 Hz. A, average response of L5A cells. B, average response of L5B cells. C, average percentage of subsequent responses (±s.e.m.) compared to first response amplitude.
Figure 13
Figure 13. Responses to single and multi-whisker stimulation
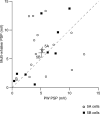
Plot of multi-whisker response amplitude versus PW response amplitudes for L5A and L5B cells. The two bars indicate the means ±s.e.m.
Figure 14
Figure 14. Responses to contralateral versus ispilateral multi-whisker stimulation
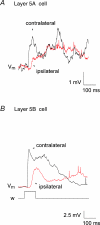
Average membrane potential changes evoked in a L5A and a L5B cell by multi-whisker airpuff stimuli delivered to contralateral and ipsilateral whiskers.

References

    1. Ahissar E, Sosnik R, Bagdasarian K, Haidarliu S. Temporal frequency of whisker movement. II. Laminar organization of cortical representations. J Neurophysiol. 2001;86:354–367. - PubMed
    1. Ahissar E, Sosnik R, Haidarliu S. Transformation from temporal to rate coding in a somatosensory thalamocortical pathway. Nature. 2000;406:302–306. - PubMed
    1. Anderson J, Lampl I, Reichova I, Carandini M, Ferster D. Stimulus dependence of two-state fluctuations of membrane potential in cat visual cortex. Nat Neurosci. 2000;3:617–621. - PubMed
    1. Armstrong-James M, Fox K. Spatiotemporal convergence and divergence in the rat S1 ‘barrel’ cortex. J Comp Neurol. 1987;263:265–281. - PubMed
    1. Armstrong-James M, Fox K, Das-Gupta A. Flow of excitation within rat barrel cortex on striking a single vibrissa. J Neurophysiol. 1992;68:1345–1358. - PubMed

Publication types

LinkOut - more resources