. 2004 Apr 1;556(Pt 1):61-78.
doi: 10.1113/jphysiol.2003.055434. Epub 2004 Jan 14.

Two modes of polyamine block regulating the cardiac inward rectifier K+ current IK1 as revealed by a study of the Kir2.1 channel expressed in a human cell line

Affiliations

Two modes of polyamine block regulating the cardiac inward rectifier K+ current IK1 as revealed by a study of the Kir2.1 channel expressed in a human cell line

Keiko Ishihara et al. J Physiol. .

Abstract

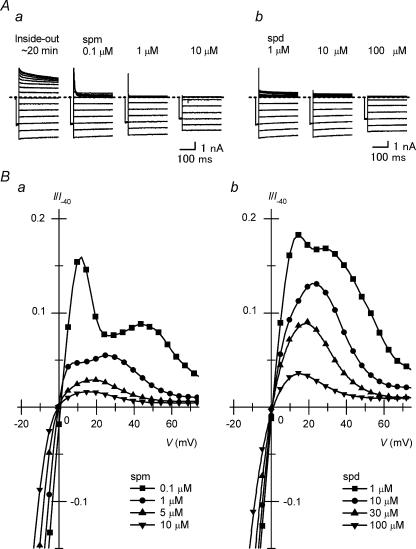
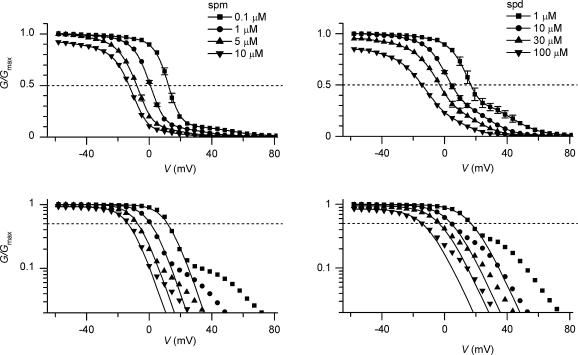
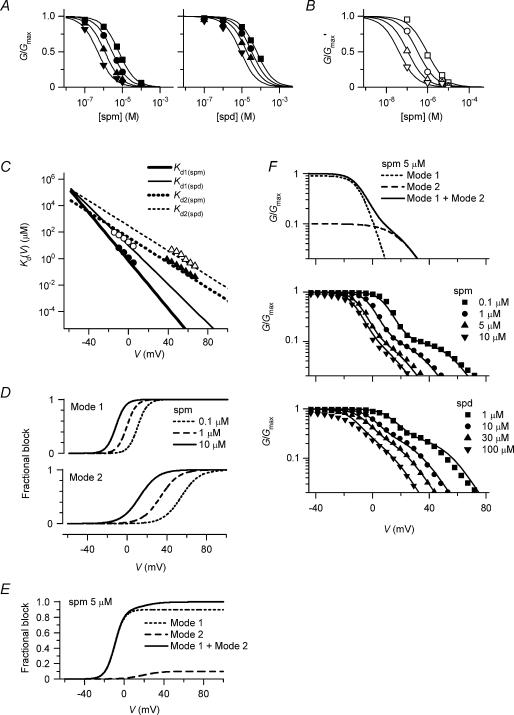
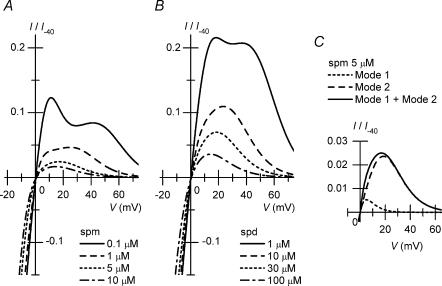
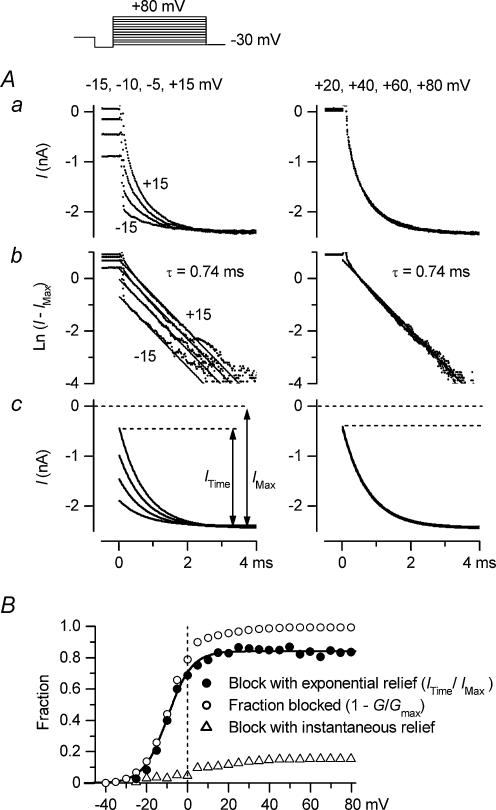
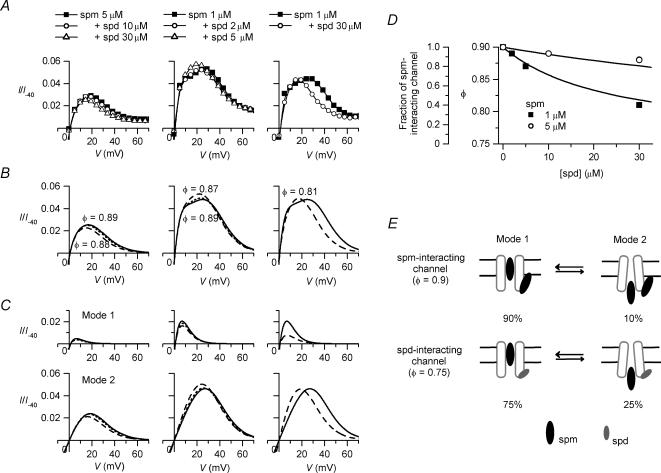
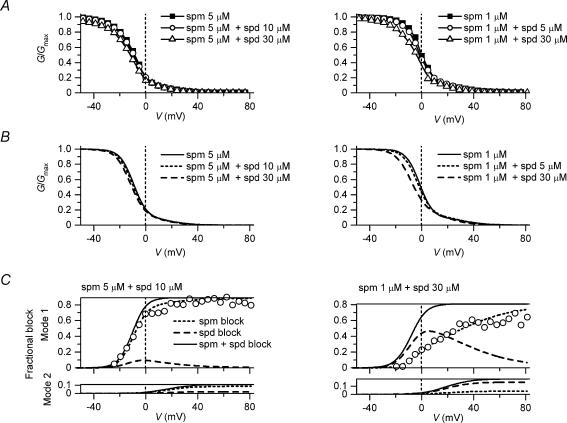
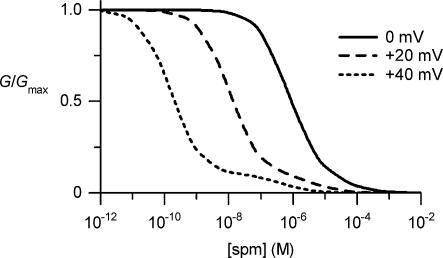
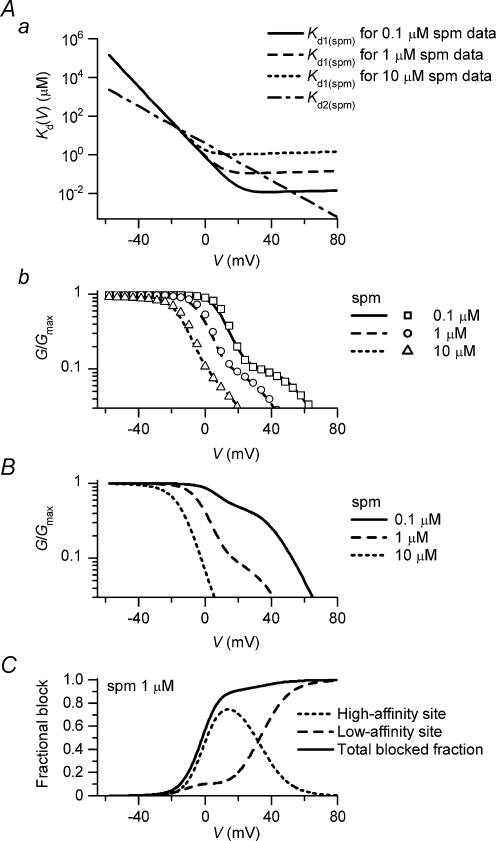
The strong inward rectifier K(+) current, I(K1), shows significant outward current amplitude in the voltage range near the reversal potential and thereby causes rapid repolarization at the final phase of cardiac action potentials. However, the mechanism that generates the outward I(K1) is not well understood. We recorded currents from the inside-out patches of HEK 293T cells that express the strong inward rectifier K(+) channel Kir2.1 and studied the blockage of the currents caused by cytoplasmic polyamines, namely, spermine and spermidine. The outward current-voltage (I-V) relationships of Kir2.1, obtained with 5-10 microm spermine or 10-100 microm spermidine, were similar to the steady-state outward I-V relationship of I(K1), showing a peak at a level that is approximately 20 mV more positive than the reversal potential, with a negative slope at more positive voltages. The relationships exhibited a plateau or a double-hump shape with 1 microm spermine/spermidine or 0.1 microm spermine, respectively. In the chord conductance-voltage relationships, there were extra conductances in the positive voltage range, which could not be described by the Boltzmann relations fitting the major part of the relationships. The extra conductances, which generated most of the outward currents in the presence of 5-10 microm spermine or 10-100 microm spermidine, were quantitatively explained by a model that considered two populations of Kir2.1 channels, which were blocked by polyamines in either a high-affinity mode (Mode 1 channel) or a low-affinity mode (Mode 2 channel). Analysis of the inward tail currents following test pulses indicated that the relief from the spermine block of Kir2.1 consisted of an exponential component and a virtually instantaneous component. The fractions of the two components nearly agreed with the fractions of the blockages in Mode 1 and Mode 2 calculated by the model. The estimated proportion of Mode 1 channels to total channels was 0.9 with 0.1-10 microm spermine, 0.75 with 1-100 microm spermidine, and between 0.75 and 0.9 when spermine and spermidine coexisted. An interaction of spermine/spermidine with the channel at an intracellular site appeared to modify the equilibrium of the two conformational channel states that allow different modes of blockage. Our results suggest that the outward I(K1) is primarily generated by channels with lower affinities for polyamines. Polyamines may regulate the amplitude of the outward I(K1), not only by blocking the channels but also by modifying the proportion of channels that show different sensitivities to the polyamine block.


Figures

Figure 1
Figure 1. Outward I–V relationships of Kir2.1 currents in the presence of cytoplasmic spermine and spermidine
A, families of currents recorded from a patch membrane in the presence of 0.1, 1 and 10μm spermine (spm; a) or 1, 10 and 100μm spermidine (spd; b) using test pulses between –60 and +80mV in 10mV steps. Currents recorded in the control polyamine-free, Mg2+-free cytoplasmic solution at ∼20 min after the patch excision are also shown in (a). In this study, current recordings were made at room temperature and symmetrical [K+] of ∼150mm. Currents shown in Aa and Ab were obtained from different patches. B, I–V relationships in the presence of 0.1μm (▪), 1μm (•), 5μm (▴), 10μm (▾) spermine (a); and 1μm (▪), 10μm (•), 30μm (▴), 100μm (▾) spermidine (b). Currents shown in A were selected from those used to obtain these relationships. Current amplitudes are normalized with respect to the inward current amplitude at −40mV measured with 0.1μm spermine (a) or 1μm spermidine (b).
Figure 2
Figure 2. G–V relationships of Kir2.1 currents obtained with various concentrations of cytoplasmic polyamines
Left, spermine (spm) 0.1μm (▪), 1μm (•), 5μm (▴), 10μm (▾). Right, spermidine (spd) 1μm (▪), 10μm (•), 30μm (▴), 100μm (▾). Data are the means of 3–12 experiments. Error bars are not shown if they were smaller than the symbols. G/Gmax= 0.5 is shown by a horizontal dotted line to indicate V1/2. The same G–V relationships are plotted on a semilogarithmic scale in the lower panels. The continuous lines in the lower panels show the fits with Boltzmann relations to values at around V1/2. The slope factor of the Boltzmann relations was ∼6mV with spermine and ∼8mV with spermidine.
Figure 3
Figure 3. A model reconstructing G–V relationships of Kir2.1 obtained in the presence of polyamines
A, dose–response relationships of the spermine block (spm; left) and the spermidine block (spd; right) examined at −10 (▪), −5 (•), 0 (▴) and +5mV (▾). G/Gmax values are the mean values of the data shown in Fig. 2. The Hill equation, G/Gmax = (1 +[PA]/Kd)−1, is fitted to each relationship. B, normalized dose–response relationships of the spermine block at +40 (□), +50 (○), +60 (▵) and +70mV (▿). The values of G/Gmax′ shown were obtained by normalizing the G/Gmax values with the maximum value in the voltage range between +40 and +70mV after subtracting a minute background conductance. Similar analyses were performed for the spermidine block. C, voltage dependences of the Kd(V) values of the spermine block (thick lines) and the spermidine block (thin lines) in Mode 1 (Kd1(spm)(V) and Kd1(spd)(V); continuous lines) and Mode 2 (Kd2(spm)(V) and Kd2(spd)(V); dotted lines). The Kd values obtained from dose–response relationships are shown by symbols (filled symbols, spermine; open symbols, spermidine). See text for equations reconstructing Kd1(spm)(V), Kd1(spd)(V), Kd2(spm)(V) and Kd2(spd)(V) values. D, fractional blockages of Mode 1 (upper panel) and Mode 2 (lower panel) channels by spermine at different voltages, calculated using Kd1(spm)(V) and Kd2(spm)(V) values, respectively (dotted line, 0.1μm; dashed line, 1μm; continuous line, 10μm). E, fractional blockage of currents in Mode 1 (dotted line) and Mode 2 (dashed line) at 5μm spermine calculated by the model. The proportion of Mode 1 channels to total channels (φ) is 0.9. The continuous line indicates the sum of the two fractions. F, reconstruction of G–V relationships obtained with various concentrations of spermine and spermidine. The continuous lines are G/Gmax values calculated using eqn (3) with Kd(V) values shown in C and φ values of 0.9 and 0.75 for the spermine and spermidine data, respectively. Symbols are the mean data values shown in Fig. 2. The top panel illustrates how the sum of conductances generated by Mode 1 (dotted line) and Mode 2 (dashed line) channels reconstructed the G–V relationship at 5μm spermine.
Figure 4
Figure 4. Reconstruction of I–V relationships of Kir2.1 in the presence of cytoplasmic polyamines
A, calculations of I–V relationships in the presence of spermine (spm; continuous line, 0.1μm; dashed line, 1μm; dotted line, 5μm; dot–dashed line, 10μm). Compare these relationships with those shown in Fig. 1Ba. B, calculations of I–V relationships in the presence of spermidine (spd; continuous line, 1μm; dashed line, 10μm; dotted line, 30μm; dot–dashed line, 100μm). Compare these relationships with those shown in Fig. 1Bb. C, amplitudes of the outward currents generated by Mode 1 channels (dotted line) and Mode 2 channels (dashed line) in the presence of 5μm spermine. The continuous line is the sum of the two components.
Figure 5
Figure 5. Two components of the inward currents of Kir2.1 observed with 5μm spermine
A, analysis of inward tail currents at −30mV observed following 100ms test pulses applied after a hyperpolarizing prepulse. Voltages of test pulses were −15, −10, −5 and +15mV in the left column, and +20, +40, +60 and +80mV in the right column. Aa, original currents plotted versus time after applying the voltage step to −30mV. Ab, natural logarithm of the difference between amplitudes of the original current and the maximum inward current (IMax). Straight lines show fittings with a single-exponential function (time constant, 0.74ms). Ac, exponential components of inward tail currents at −30mV (ITime) reconstructed using the fitted exponentials. B, exponential fraction of the inward tail currents at −30mV (ITime/IMax; •), indicating the fraction of the block that is relieved with an exponential time course, plotted against the voltage of test pulses. Data were obtained from the experiment shown in A. The continuous line shows a fit with the Boltzmann relation (Vh=−9.8mV, s=−5.7mV). Also shown are the fractional block of currents at the end of the test pulses (○), obtained as 1 −G/Gmax, and the fraction of block that is relieved with a virtually instantaneous time course at −30mV (▵), obtained as the difference between the fraction blocked (○) and the fraction of block with an exponential relief calculated by the fitted Boltzmann relation.
Figure 6
Figure 6. Outward I–V relationships of Kir2.1 under conditions in which spermine and spermidine coexisted
A, outward I–V relationships obtained from experiments. Left, 5μm spermine (spm) (▪), 5μm spermine + 10μm spermidine (spd) (○), 5μm spermine + 30μm spermidine (▵); centre, 1μm spermine (▪), 1μm spermine + 2μm spermidine (○), 1μm spermine + 5μm spermidine (▵); right, 1μm spermine (▪), 1μm spermine + 30μm spermidine (○). Data plotted in the same panel were obtained from the same patch. Current amplitudes were normalized with respect to that at −40mV obtained with spermine alone. B, reconstruction of outward I–V relationships. Left, 5μm spermine (continuous line), 5μm spermine + 10μm spermidine (dotted line), 5μm spermine + 30μm spermidine (dashed line); centre, 1μm spermine (continuous line), 1μm spermine + 2μm spermidine (dotted line), 1μm spermine + 5μm spermidine (dashed line); right, 1μm spermine (continuous line), 1μm spermine + 30μm spermidine (dashed line). Calculations were performed using eqn (6) with Kd(V) values shown in Fig. 3C. Values of φ in the copresence of spermine and spermidine are depicted near each relationship and in the text. C, outward I–V relationships of Mode 1 channels (upper row) and Mode 2 channels (lower row) calculated by the model. D, relationship between the concentration of spermidine coexisting with spermine (▪, 1μm; ○, 5μm) and the fraction of Mode 1 channels (φ) that accounted for the outward I–V relationships. Values of φ are also shown in relation to the fraction of the spermine-interacting channels calculated by assuming that the probability of the channel existing in the state that allows the Mode 1 block is 0.9 for spermine-interacting channels and 0.75 for spermidine-interacting channels. The continuous lines are the fraction of the spermine-interacting channels calculated by ([spermine]/0.002)/(1 +[spermine]/0.002 +[spermidine]/0.05), where [spermine] and [spermidine] are in micromolar concentrations. E, hypothetical mechanism of modification of the ratio of Mode 1 channels to Mode 2 channels by cytoplasmic polyamine. Interaction of spermine or spermidine with the Kir2.1 channel at an intracellular site may change the equilibrium of the two conformational states of the channel allowing different modes of blockage.
Figure 7
Figure 7. Spermine block and spermidine block of Kir2.1 channels under conditions in which spermine and spermidine coexisted
A, G–V relationships obtained from experiments. Left, 5μm spermine (spm) (▪), 5μm spermine + 10μm spermidine (spd) (○), 5μm spermine + 30μm spermidine (▵); right, 1μm spermine (▪), 1μm spermine + 5μm spermidine (○;), 1μm spermine + 30μm spermidine (▵). B, reconstruction of G–V relationships. Left, 5μm spermine (continuous line), 5μm spermine + 10μm spermidine (dotted line), 5μm spermine + 30μm spermidine (dashed line); right, 1μm spermine (continuous line), 1μm spermine + 5μm spermidine (dotted line), 1μm spermine + 30μm spermidine (dashed line). Calculations were performed using eqn (6) with Kd(V) values shown in Fig. 3C and the φ values used for the calculations shown in Fig. 6. C, fractional block of Mode 1 channels (upper panels) and Mode 2 channels (lower panels) by spermine (dotted line) and spermidine (dashed line) calculated for 5μm spermine + 10μm spermidine with a φ value of 0.89 (left) and 1μm spermine + 30μm spermidine with a φ value of 0.81 (right). Continuous lines show the sum of fractional blockages caused by spermine and spermidine. The experimental data showing the relationship between the voltages of test pulses and the exponential fraction of inward tail currents at −30mV (ITime/IMax, explained in Fig. 5) obtained under each condition are superimposed (○). Data in A and C were obtained from the same patch.
Figure 8
Figure 8. Reconstructed dose–response relationships of the spermine block of the Kir2.1 channel at 0, +20 and +40mV
These relationships were calculated using eqn (3) with a φ value of 0.9 and the Kd1(spm)(V) and Kd2(spm)(V) values shown in Fig. 3C. The relationship at +40mV shows two phases, as has been reported (Yang et al. 1995). According to our view, the hump of conductances observed at higher concentrations is generated by the channels showing lower sensitivity to spermine.
Figure 9
Figure 9. Examination of the model of the polyamine block incorporating two blocked states in a single type of channel
A, fits of G–V relationships obtained with 0.1, 1 and 10μm spermine. Aa, Kd(V) values of the spermine block at the high-affinity site (Kd1(spm)(V)) and the low-affinity site (Kd2(spm)(V)) that could fit the data. Kd1(spm)(V) values were different for 0.1μm (continuous line), 1μm (dashed line) and 10μm (dotted line) spermine in the positive voltage range. Kd1(spm)(V) determined for the 1μm spermine data was calculated by 0.8exp(−V/4.8) + 0.1exp(V/200) (in μm). Kd2(spm)(V) was calculated by 4exp(−V/9.1) (in μm) for all spermine concentrations (dot–dashed line). Ab, G–V relationships calculated by eqn (9) using the Kd1(spm)(V) and Kd2(spm)(V) values shown in A. Experimental data shown by symbols (□, 0.1μm; ○, 1μm; ▵, 10μm) are the same as those shown in Fig. 2. B, G–V relationships calculated at 0.1, 1 and 10μm spermine using Kd1(spm)(V) determined for the 1μm spermine data. C, fractional blockage of currents at the high-affinity site (dotted line) and the low-affinity site (dashed line) calculated at 1μm spermine. The continuous line indicates the sum of the two fractions.

References

    1. Fabiato A, Fabiato F. Calculator programs for computing the composition of the solutions containing multiple metals and ligands used for experiments in skinned muscle cells. J Physiol Paris. 1979;75:463–505. - PubMed
    1. Fakler B, Brandle U, Glowatzki E, Weidemann S, Zenner H-P, Ruppersberg JP. Strong voltage-dependent inward rectification of inward rectifier K+ channels is caused by intracellular spermine. Cell. 1995;80:149–154. - PubMed
    1. Ficker E, Taglialatela M, Wible BA, Henley CM, Brown AM. Spermine and spermidine as gating molecules for inward rectifier K+ channels. Science. 1994;266:1068–1072. - PubMed
    1. Giles WR, Imaizumi Y. Comparison of potassium currents in rabbit atrial and ventricular cells. J Physiol. 1988;405:123–145. - PMC - PubMed
    1. Guo D, Lu Z. Mechanism of IRK1 channel block by intracellular polyamines. J Gen Physiol. 2000a;115:799–813. - PMC - PubMed

Publication types

LinkOut - more resources