. 2004 Jan 14;24(2):341-9.
doi: 10.1523/JNEUROSCI.3358-03.2004.

Small clusters of electrically coupled neurons generate synchronous rhythms in the thalamic reticular nucleus

Affiliations

Small clusters of electrically coupled neurons generate synchronous rhythms in the thalamic reticular nucleus

Michael A Long et al. J Neurosci. .

Abstract

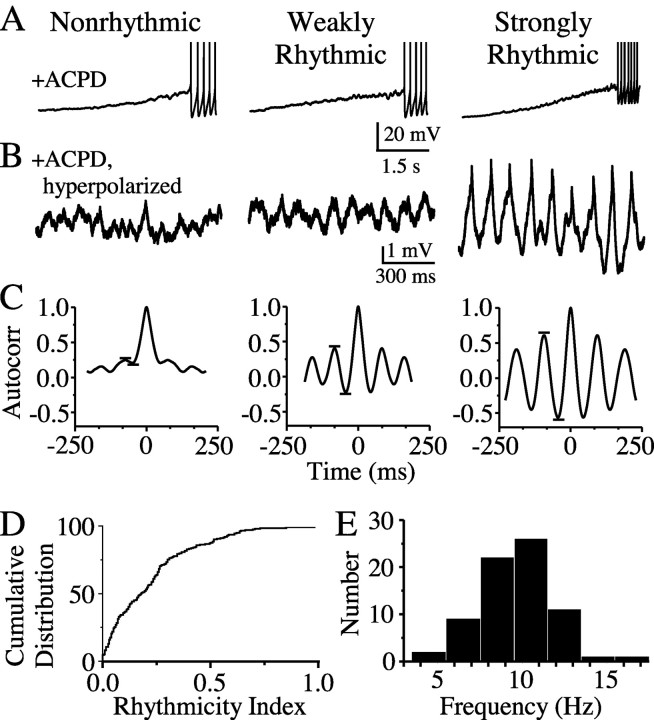
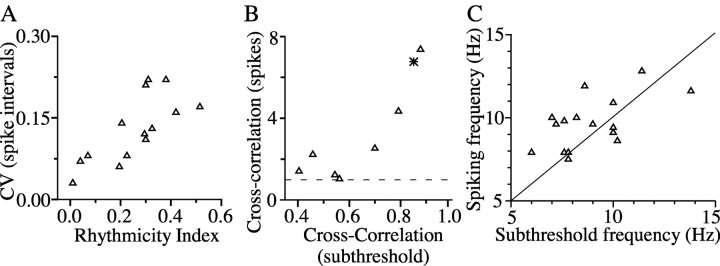
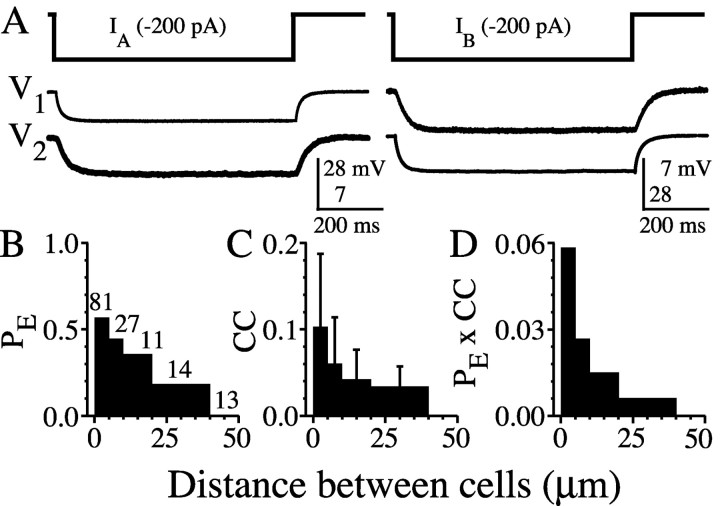
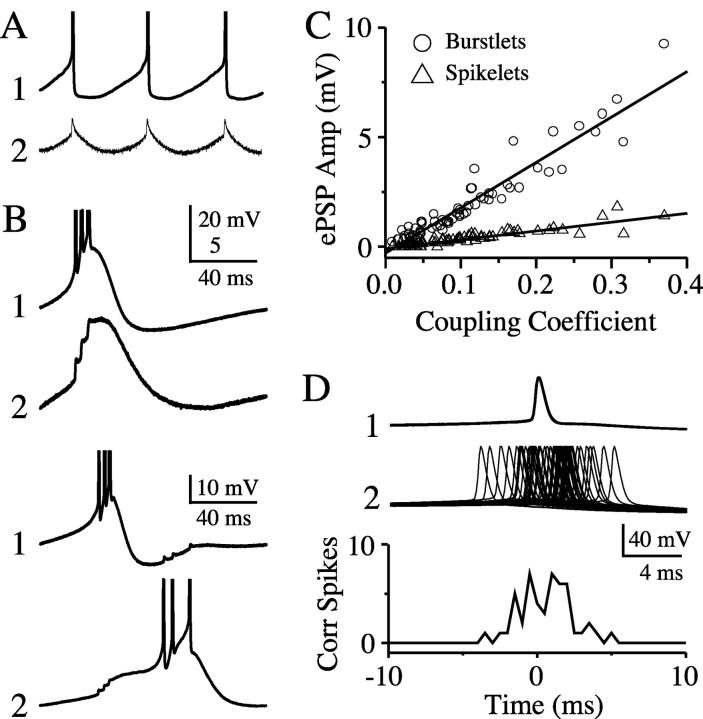
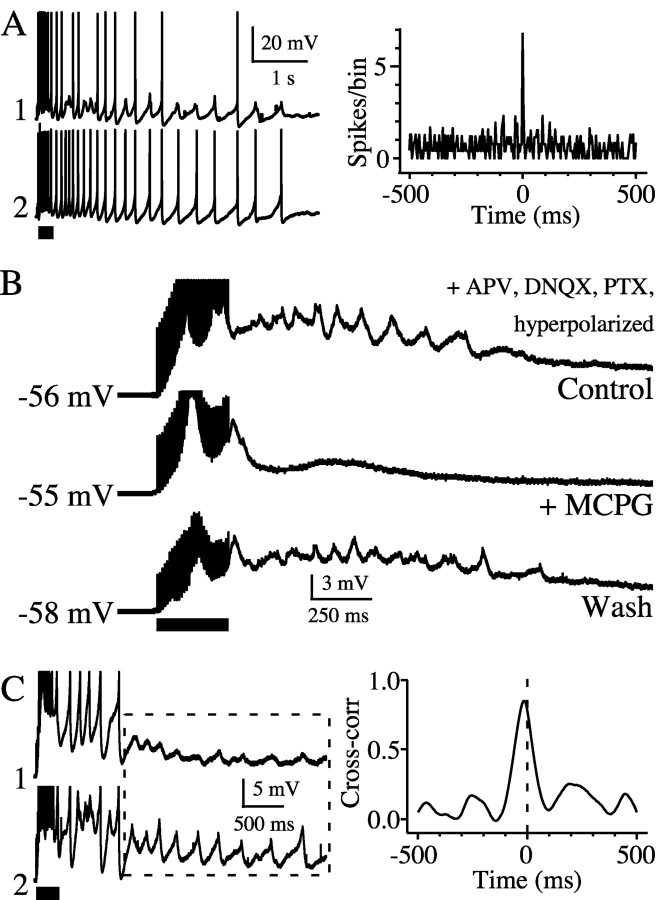
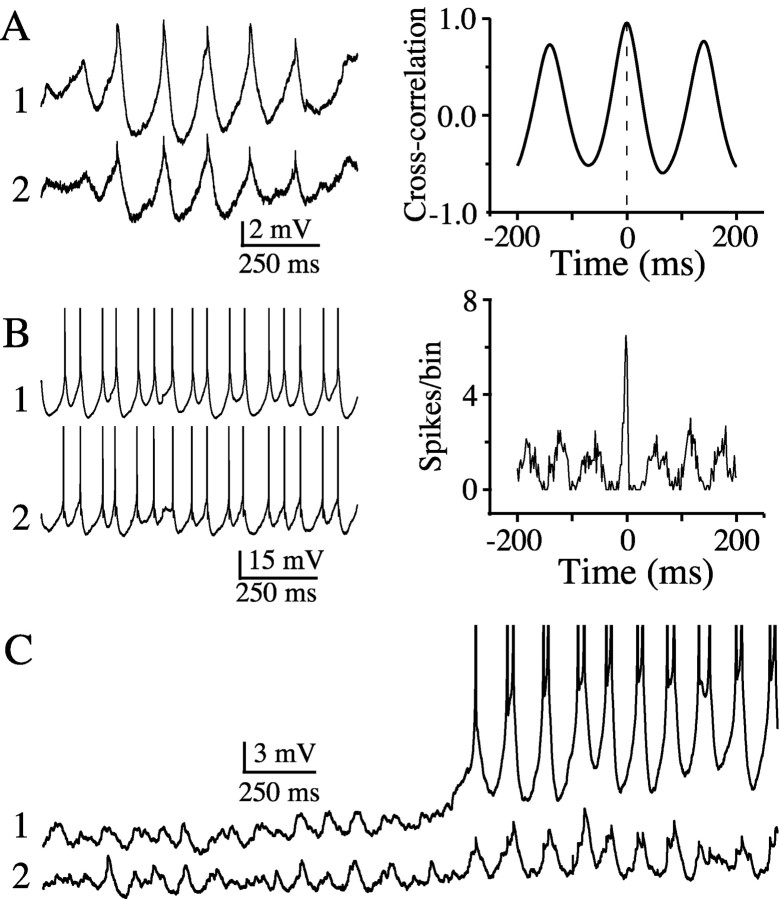
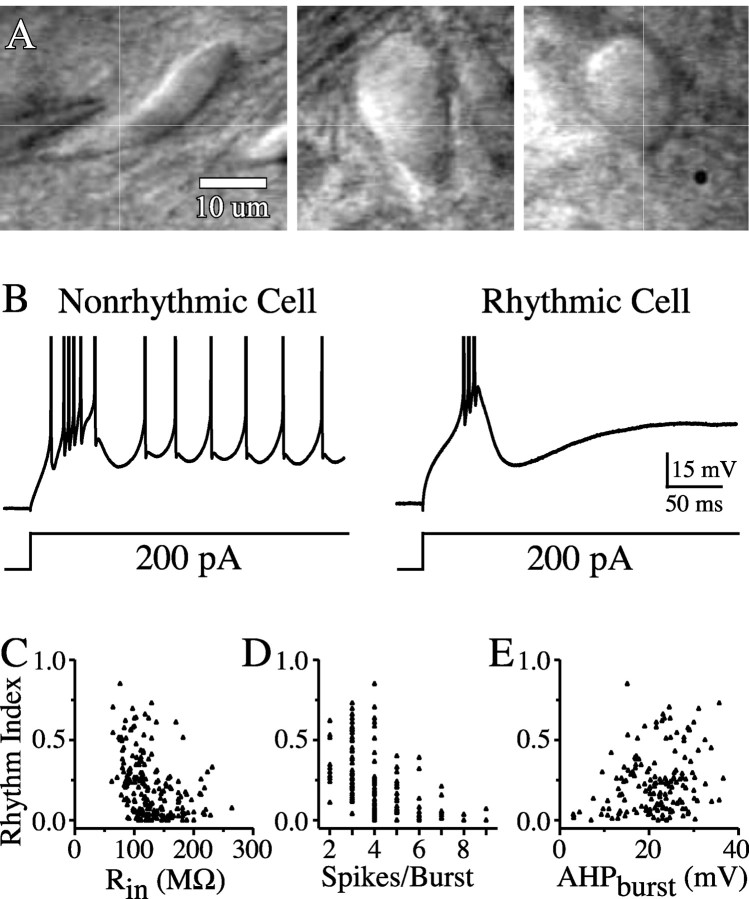
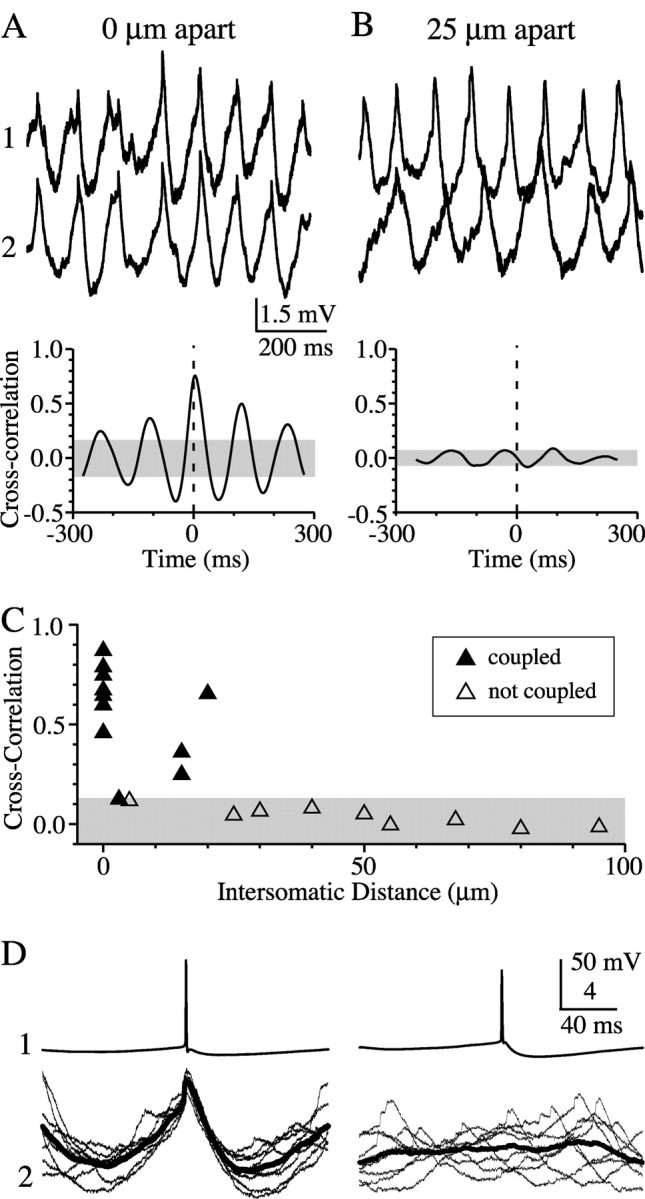
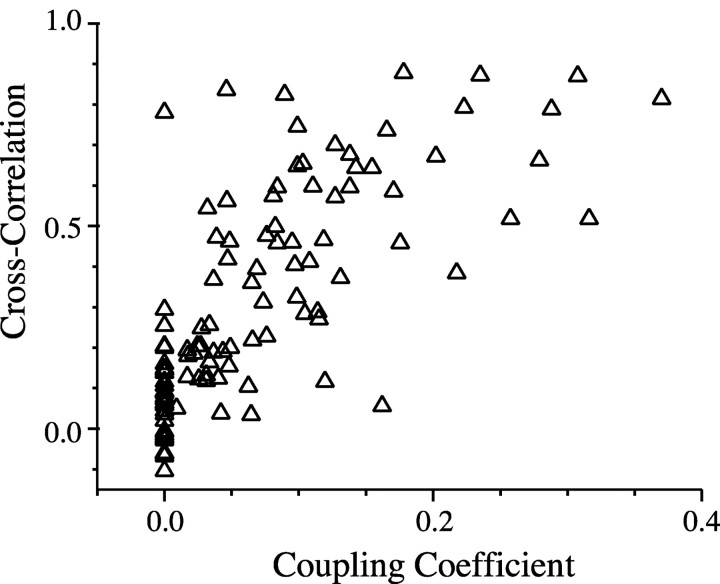
The inhibitory neurons of the thalamic reticular nucleus (TRN) contribute to the generation of widespread oscillations in the thalamocortical system. Some TRN neurons are interconnected by electrical synapses, and here we tested the possibility that electrical synapses mediate rhythmic synchrony in juvenile rats. Both the incidence and strength of electrical coupling between pairs of TRN neurons were a steep function of intersomatic distance, and coupling was absent at distances >40 microm. Presynaptic spike bursts evoked much larger electrical postsynaptic potentials than did single presynaptic spikes. Activation of metabotropic glutamate receptors (mGluRs) with a bath-applied agonist or an endogenous ligand released during tetanic stimulation induced robust rhythms of the subthreshold membrane potential, with a mean frequency of approximately 10 Hz. In the absence of fast chemical synaptic transmission, subthreshold rhythms and the action potentials that they evoked were well synchronized between closely spaced, electrically coupled pairs; rhythms in noncoupled cells were not synchronized. The results suggest that electrical synapses can coordinate spindle-frequency rhythms among small clusters of mGluR-activated TRN cells.


Figures

Figure 3.
Figure 3.
mGluR agonists differentially affect TRN neurons. A, The mGluR agonist ACPD (50 μm) strongly depolarized and triggered spiking in all neurons tested. No relationship was seen between the magnitude of depolarizations and spiking frequency across cells. Spike amplitudes are truncated. B, Steady hyperpolarizing current in the presence of ACPD revealed a range of subthreshold rhythmicity; same cells as shown in A. C, Autocorrelograms based on 5 sec epochs of ACPD induced rhythmicity in the presence of steady hyperpolarizing current (same cells as shown in A and B). Horizontal lines highlight the primary autocorrelogram side peaks from which subthreshold rhythmicity index was calculated. These examples illustrate nonrhythmic (rhythmicity index = 0.03), weakly rhythmic (0.30), and strongly rhythmic (0.56) neurons. D, Cumulative histogram of rhythmicity scores from all cells tested (n = 202). E, Histogram showing distribution of peak frequency of subthreshold ACPD activity for all rhythmically responding cells (subthreshold rhythmicity index ≥0.25; n = 74).
Figure 6.
Figure 6.
Rhythmicity and synchrony of subthreshold and spiking activity. A, To gauge the influence of subthreshold rhythmicity on spiking, the rhythmicity index is plotted against the coefficient of variation (CV; SD/mean) of the interspike interval of the spikes for 14 neurons. B, Subthreshold cross-correlation predicts peak synchrony of spiking (triangles: 7 cell pairs in ACPD; star: one cell pair after tetanic stimulation). Dashed line denotes baseline level of spike cross-correlation. C, Peak subthreshold frequency correlates with modal spiking frequency in 16 rhythmic neurons. The line indicates a slope of 1.
Figure 1.
Figure 1.
The spatial extent of electrical coupling in the TRN. A, Injection of hyperpolarizing current (-200 pA) into one cell of an electrically coupled TRN pair results in a voltage deflection of the electrically coupled cell. Injections into cell 1 (IA, left) and cell 2 (IB, right) yielded essentially identical voltage deflections, indicating a symmetrical junction. B-D, The probability of coupling (PE; coupled pairs per measured pairs), coupling coefficient (CC), and total coupling strength (PE × CC) is strongly dependent on intersomatic distance.
Figure 2.
Figure 2.
Electrical postsynaptic potentials. Electrically coupled pairs exhibited a range of electrical postsynaptic potentials (ePSPs) in the absence of fast chemical transmission. A, Single spikes in cell 1 produced sharp postsynaptic spikelets in cell 2. B, Spike bursts in cell 1 triggered robust burstlet responses in cell 2 (top two traces); burstlets were capable of eliciting postsynaptic spikes (bottom traces). C, Plot of the amplitudes of spikelets and burstlets versus coupling coefficient for 68 neuron pairs. The slope of the burstlet regression line is ∼5× that of the spikelet data. D, Single spikes of electrically coupled neurons can closely synchronize. Depolarizing current was injected into both cells to induce mean rates of ∼10 Hz. Spikes from cell 1 were used to trigger overlays of spikes in cell 2 (top traces); these show clustering around 0 msec, which is reflected in the spike cross-correlogram (bin size = 0.5 msec; bottom graph). Action potential amplitudes in A and B are truncated.
Figure 7.
Figure 7.
Tetanic stimulation evokes mGluR-induced rhythmicity. A, In the presence of AP5 (NMDA antagonist), DNQX (AMPA antagonist), and increased extracellular potassium (6 mm KCl), tetanic stimulation of the internal capsule (bar) induced synchronous spiking in an electrically coupled TRN pair. Cross-correlogram is based on spikes generated after the tetanic stimulus (values for each bin were normalized by the mean number of spikes per bin). B, In the presence of steady hyperpolarizing current, tetanic stimuli elicited prolonged rhythmic depolarization that was reversibly blocked by the mGluR antagonist MCPG. C, Stimulation-induced subthreshold rhythmicity was correlated in an electrically coupled neuron pair.
Figure 5.
Figure 5.
Subthreshold rhythms can synchronize spikes. A, A hyperpolarized pair of TRN cells that show strongly synchronous and rhythmic subthreshold activity in response to ACPD application, as reflected in the corresponding cross-correlogram (values for each bin were normalized by the mean number of spikes per bin). B, ACPD-induced spike synchrony in the absence of hyperpolarizing holding current. Action potentials are truncated in these traces. C, Paired recordings during ACPD-induced rhythms. Initially both cells generated well synchronized subthreshold rhythms; as cells depolarized slightly, cell 1 began to spike. Rhythmic spikes in cell 1 were consistently well correlated with the peaks of the subthreshold rhythms in cell 2.
Figure 4.
Figure 4.
Physiological properties of rhythmically responsive cells. A, IR-DIC images of TRN neurons showing the range of soma shapes. Neither the shape nor size of somata was correlated with the strength of ACPD-induced rhythmicity. B, Example of bursts from a rhythmic and nonrhythmic TRN cells. Action potentials are truncated. C, Input resistance was negatively correlated with rhythmicity index (n = 202 cells). D, The number of action potentials per burst was negatively correlated with rhythmicity index (n = 168 cells). E, The amplitude of the burst after-hyperpolarization (AHPburst, measured as the difference in voltage from the crest of the burst to the following voltage trough) was positively correlated with rhythmicity index (n = 158 cells). Rin, Input resistance.
Figure 9.
Figure 9.
Localized clusters of synchronous activity within the TRN. Strongly synchronous ACPD-induced rhythms were common in neuron pairs that were closely spaced (A) but not in pairs more widely spaced (B). Mean frequencies of fluctuations in the cell pair 25 μm apart were 7.8 and 10.6 Hz, compared with 8.7 Hz in A. Cross-correlograms were calculated from 10 sec ACPD-induced rhythmic episodes that included the periods shown in top traces. C, Average cross-correlations of coupled (filled triangles; n = 12) and noncoupled (open triangles; n = 9) cell pairs in the presence of ACPD. Both electrical coupling and synchrony were a steep function of intersomatic distance. Shaded regions in all graphs represent the 95% confidence intervals calculated from randomly shuffled traces. D, Overlay of spike-triggered rhythmic events (bold line = mean spike-triggered response). Spike-triggered pair from 25 μm is the same shown in A and B; spike-triggered data from 0 μm were taken from a different pair (CC = 0.18).
Figure 8.
Figure 8.
Electrical coupling strength correlates with synchrony of subthreshold rhythms (n = 100 neuron pairs).

References

    1. Agmon A, Connors BW (1991) Thalamocortical responses of mouse somatosensory (barrel) cortex in vitro. Neuroscience 41: 365-379. - PubMed
    1. Amitai Y, Gibson JR, Beierlein M, Patrick SL, Ho AM, Connors BW, Golomb D (2002) The spatial dimensions of electrically coupled networks of interneurons in the neocortex. J Neurosci 22: 4142-4152. - PMC - PubMed
    1. Avanzini G, de Curtis M, Panzica F, Spreafico R (1989) Intrinsic properties of nucleus reticularis thalami neurones of the rat studied in vitro. J Physiol (Lond) 416: 111-122. - PMC - PubMed
    1. Avanzini G, Panzica F, de Curtis M (2000) The role of the thalamus in vigilance and epileptogenic mechanisms. Clin Neurophysiol 111 [Suppl 2]: S19-26. - PubMed
    1. Bal T, McCormick DA (1993) Mechanisms of oscillatory activity in guinea-pig nucleus reticularis thalami in vitro: a mammalian pacemaker. J Physiol (Lond) 468: 669-691. - PMC - PubMed

Publication types

Substances