. 2004 Jan 14;24(2):398-411.
doi: 10.1523/JNEUROSCI.4032-03.2004.

Serotonin enhances the resistance reflex of the locomotor network of the crayfish through multiple modulatory effects that act cooperatively

Affiliations

Serotonin enhances the resistance reflex of the locomotor network of the crayfish through multiple modulatory effects that act cooperatively

Morgane Le Bon-Jego et al. J Neurosci. .

Abstract

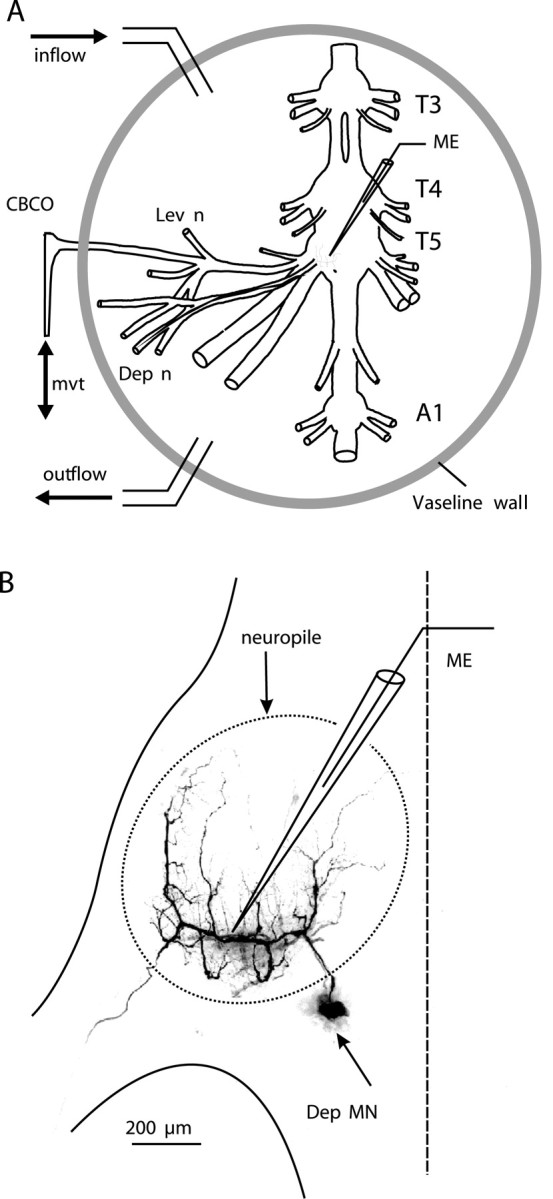
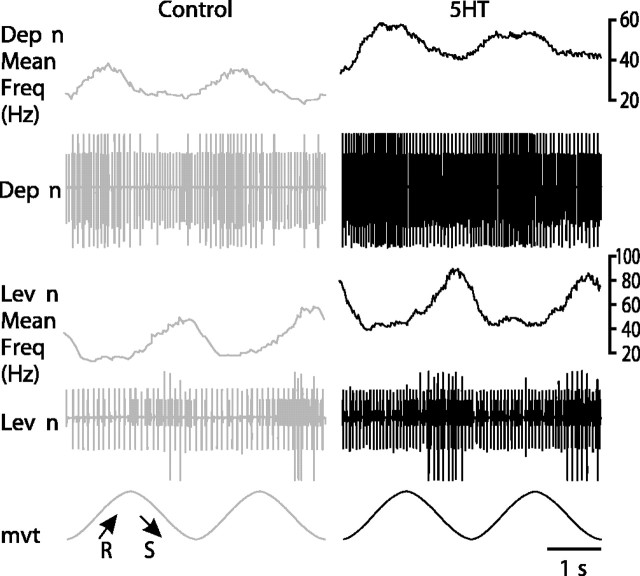
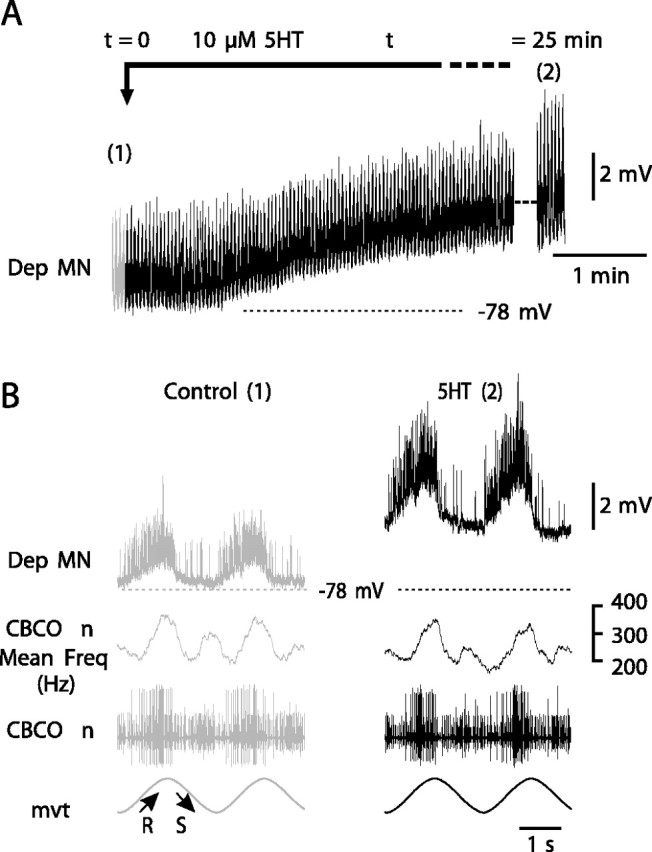
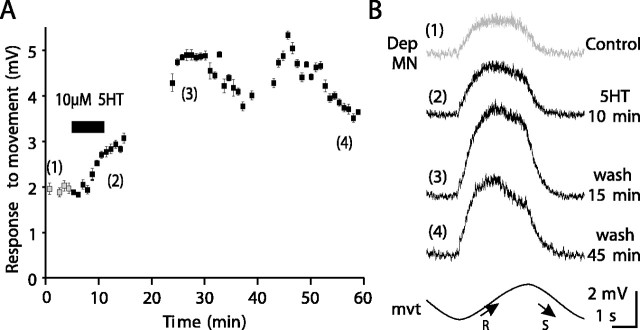
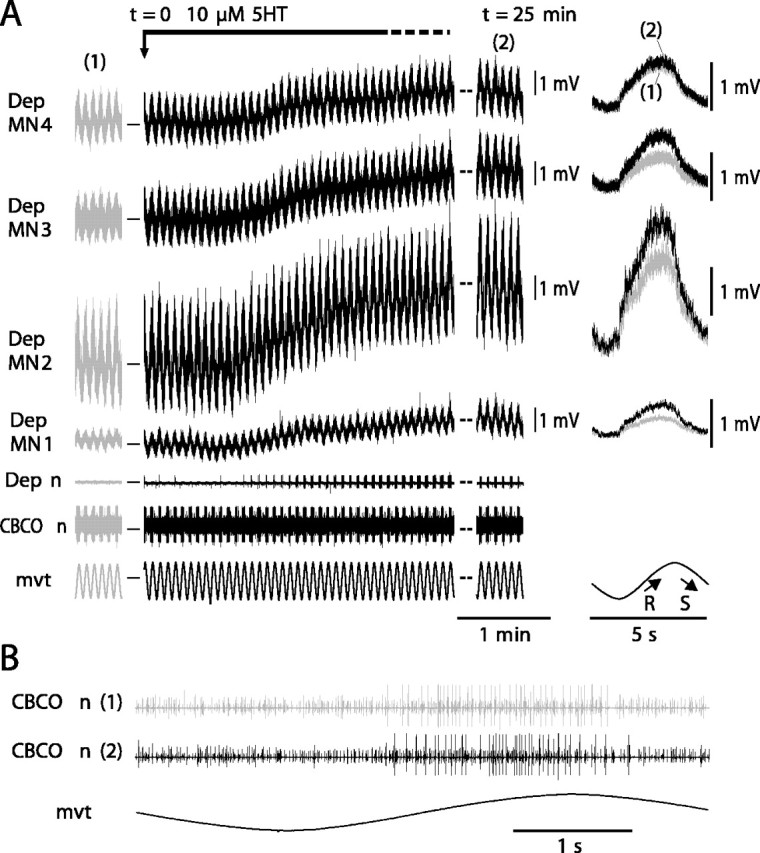
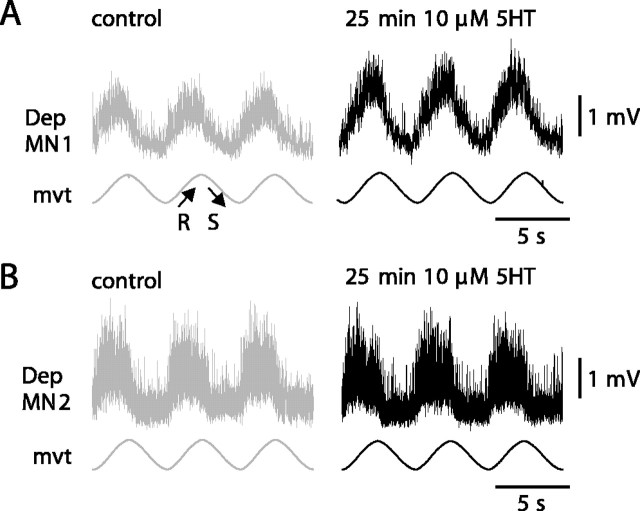
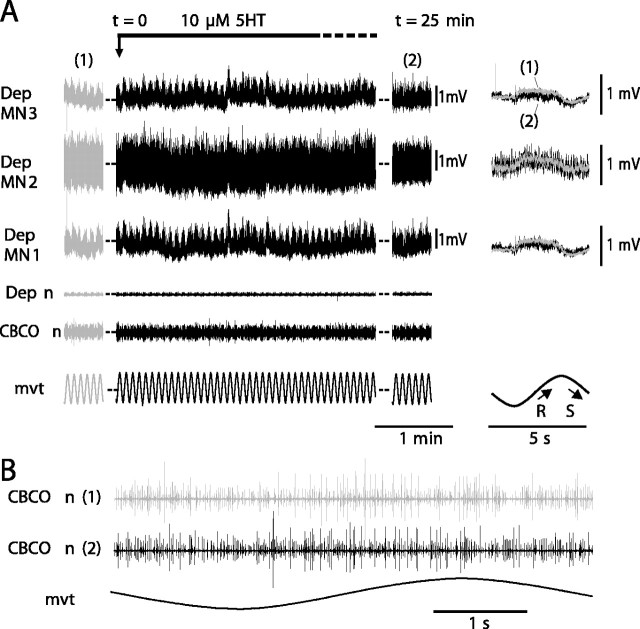
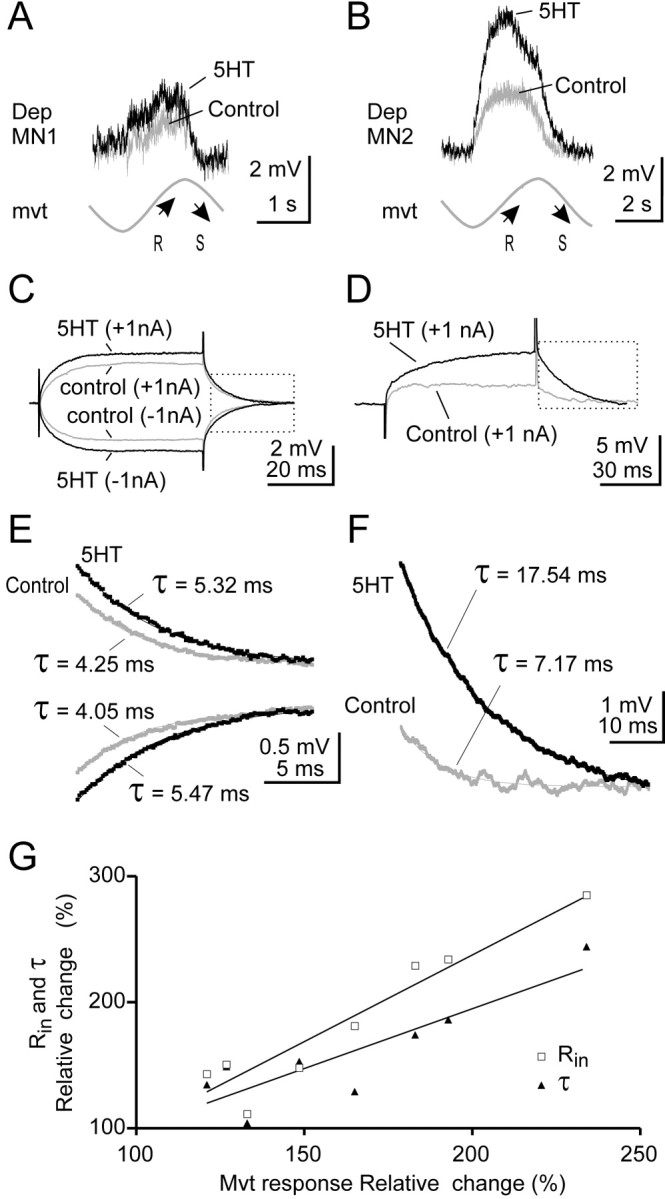
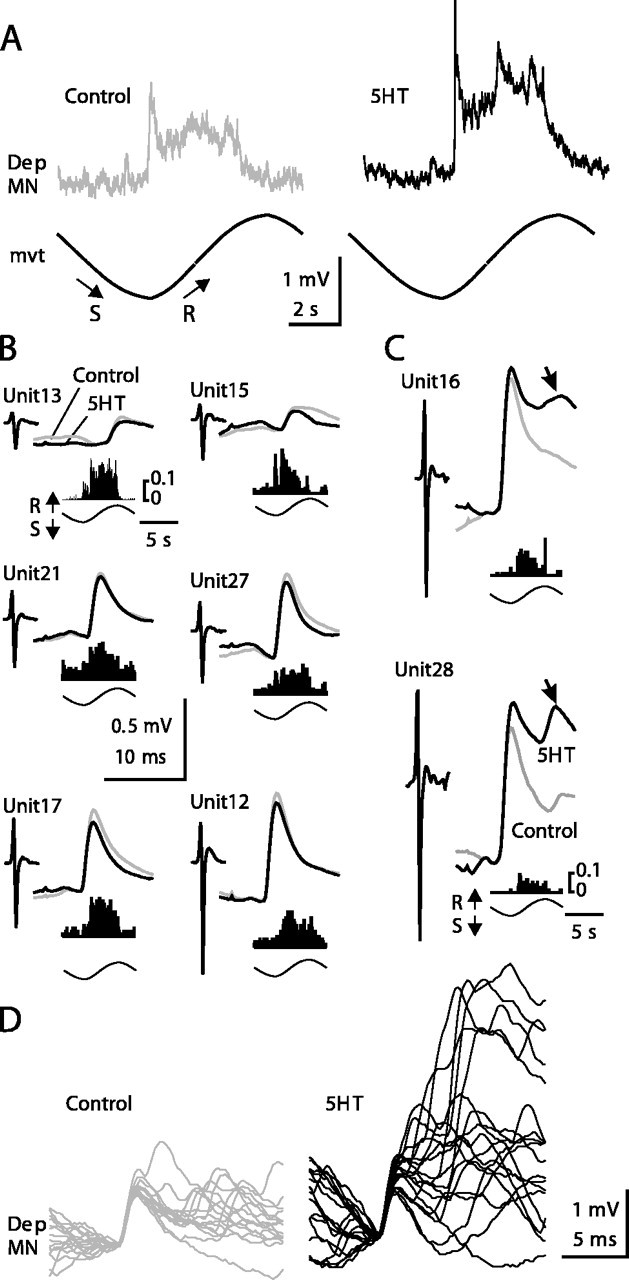
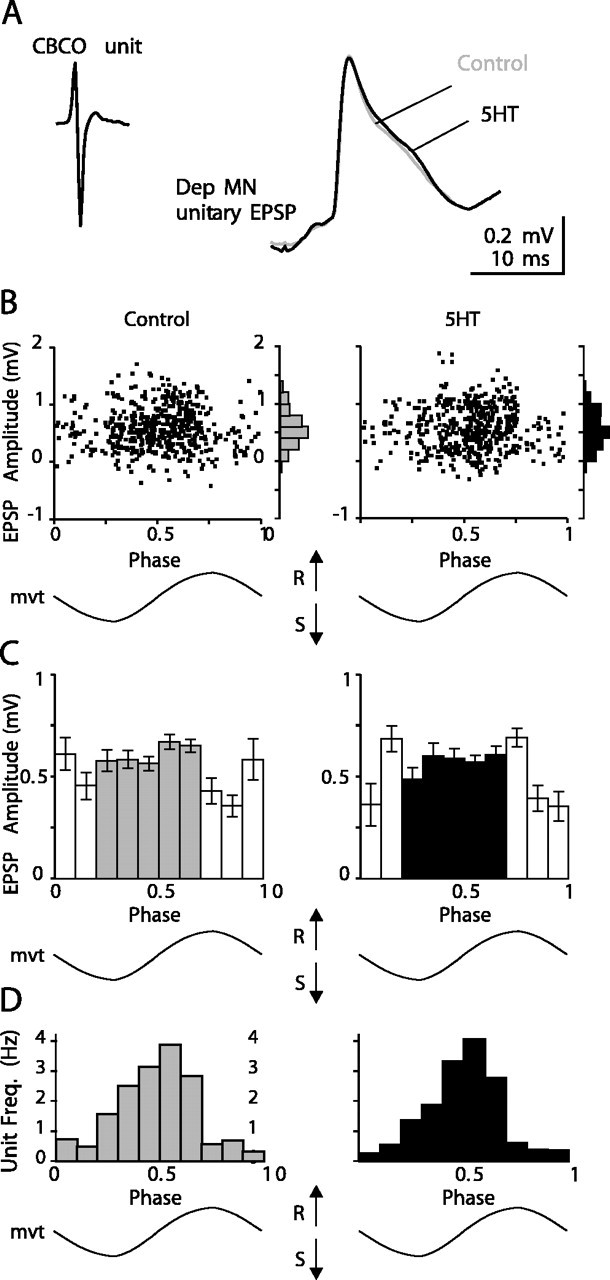
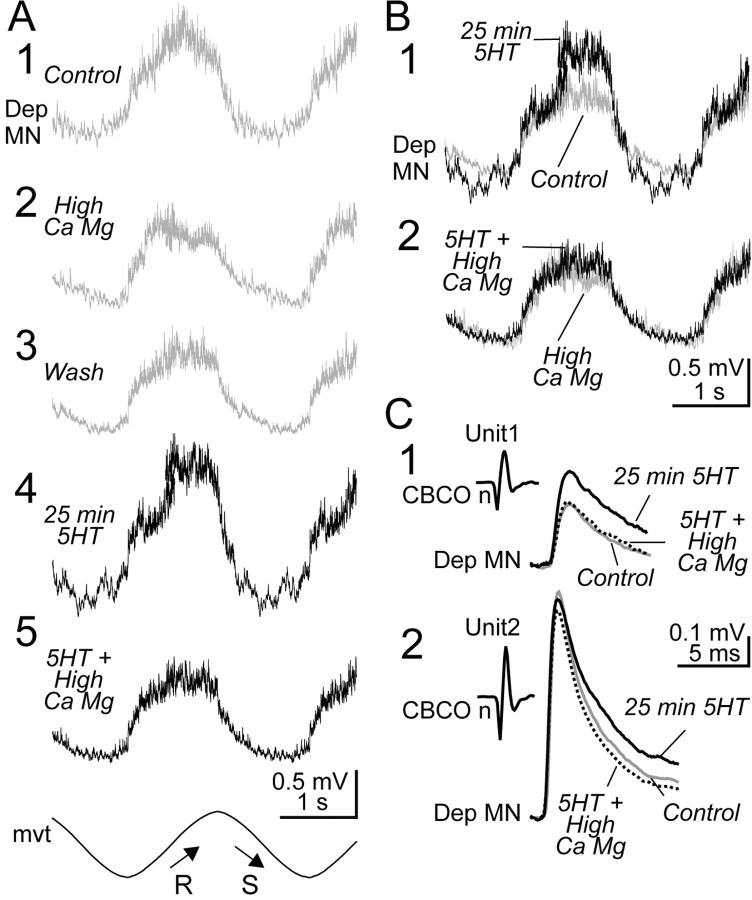
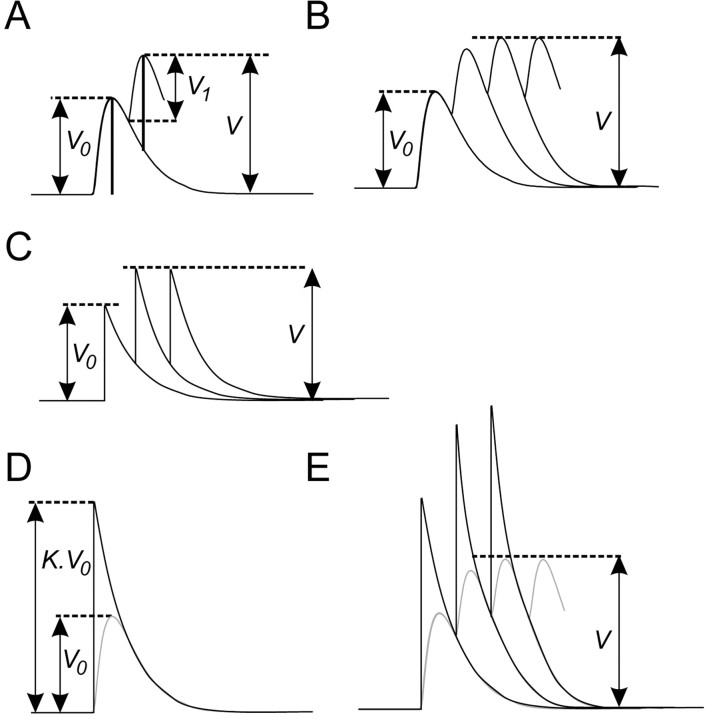
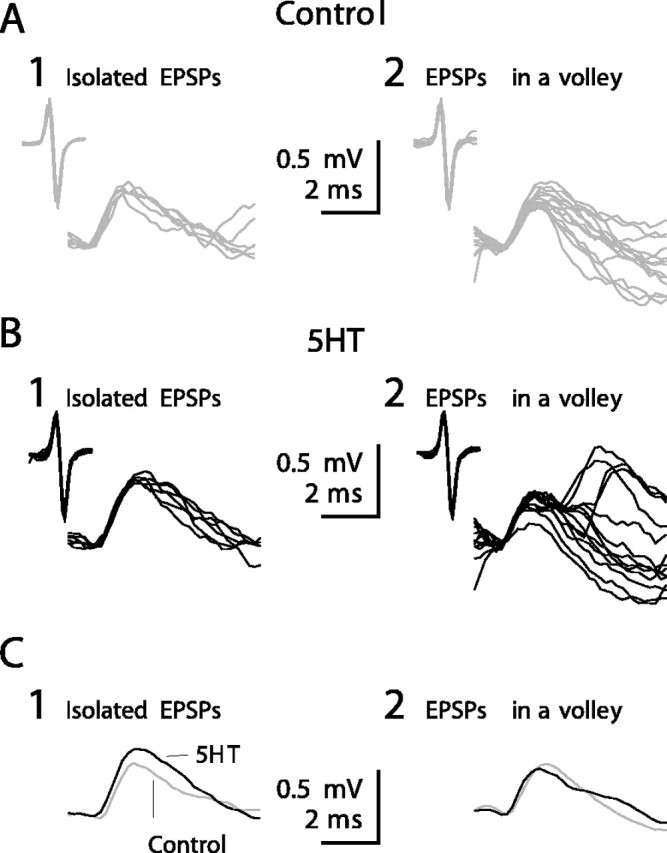
Serotonin (5HT) is an endogenous amine that modifies posture in crustacea. Here, we examined the mechanisms of action of 5HT on the resistance reflex in crayfish legs. This reflex, which counteracts movements imposed on a limb, is based on a negative feedback system formed by proprioceptors that sense joint angle movements and activate opposing motoneurons. We performed intracellular recordings from depressor motoneurons while repetitively stretching and releasing a leg joint proprioceptor in a resting in vitro preparation (i.e., a preparation that lacks spontaneous rhythmic activity). 5HT increased the amplitude of the depolarization during the release phase of the proprioceptor (corresponding to an upward movement of the leg) and the discharge frequency of the motoneurons. The 5HT-induced increase in the resistance reflex is caused, to a large extent, by polysynaptic pathways because it was very attenuated in the presence of high divalent cation solution. In addition to this activation of the polysynaptic pathways, 5HT also has postsynaptic effects that enhance the resistance reflex. 5HT causes a tonic depolarization, as well as an increase in the time constant and input resistance of motoneurons. We developed a simple mathematical model to describe the integrative properties of the motoneurons. The conclusion of this study is that the input frequency and the decay time constant of the EPSPs interact in such a way that small simultaneous changes in these parameters can cause a large effect on summation. Therefore, the conjunction of presynaptic and postsynaptic changes produces a strong cooperative effect on the resistance reflex response.


Figures

Figure 1.
Figure 1.
In vitro preparation for the study of the resistance reflex of the second leg joint of the crayfish. A, The in vitro preparation of the crayfish thoracic locomotor system consists of thoracic ganglia 3-5 (T3, T4, T5) and the first abdominal ganglion (A1) dissected out together with motor nerves of the proximal muscles (Lev; Dep) and the CBCO, a proprioceptor that encodes the vertical movements of the leg. A mechanical puller allowed us to mimic the vertical movements (mvt) of the leg by stretching and releasing the CBCO strand. The CNS was isolated from the CBCO by a Vaseline wall to superfuse only the ganglia with 5HT (10 μm). Single or multiple intracellular recordings from motoneurons and interneurons were performed within the neuropile with glass microelectrodes (ME). B, Intracellular staining of a Dep MN. This MN was filled with Dextran rhodamine and analyzed with the confocal microscope. The recording microelectrode (ME) was placed in the main neurite. The neuropile of the ganglion is indicated with a dotted line.
Figure 2.
Figure 2.
Effect of 5HT on the resistance reflex in a resting preparation. Sinusoidal movements imposed on the CBCO strand induced resistance reflex responses recorded extracellularly from the levator nerve (Lev n) and the depressor nerve (Dep n). When the CBCO strand was released (R; mimicking upward movement in the intact animals), the Dep MNs were activated. In contrast, during stretch movements (S), the Lev MNs were activated. The mean frequency of the discharge of the motor activity recorded is presented above each recording (Dep n Mean Freq, Lev n Mean Freq). The mean frequency was calculated by a floating average with a time window of 100 msec. When 5HT was superfused on the ganglia, the resistance reflex response of Dep and Lev MNs was increased.
Figure 3.
Figure 3.
Effect of 5HT on intracellularly recorded Dep MNs. A, After application of 5HT (10 μm), an intracellularly recorded Dep MN displays a slight tonic depolarization. During this recording, sinewave movements were applied continuously to the CBCO strand and evoked a resistance reflex in the Dep MN (see enlarged view in B). The amplitude of this reflex response was increased after 25 min in the presence of 5HT. B, Enlarged views of recordings presented in A. The numbers 1 and 2 refer to the control situation (A, control; t = 0) and to 25 min after onset of 5HT perfusion (A, 5HT; t = 25 min). This increase in the amplitude of the resistance reflex response was not caused by any change in the sensory activity from the CBCO nerve as demonstrated by the mean frequency of discharge of the sensory nerve of the CBCO (CBCO n Mean Freq). The resting potential in control situation is indicated by a dashed line (-78 mV) in A and B.
Figure 4.
Figure 4.
Time course of 5HT effect on the resistance reflex response. A, Amplitude of the intracellular resistance reflex responses of a Dep MN to sinewave movement imposed on the CBCO strand plotted against time. Each point is an average of the amplitude of 10 movement cycles. Error bars represent SEM. 5HT exposure is indicated by a gray bar. B, Average traces (n = 10 cycles) in four conditions: control (1), 5HT 10 min (2), wash 15 min (3), and wash 45 min (4). The 5HT-induced increase in the amplitude of the resistance reflex response persists over 45 min of washing.
Figure 6.
Figure 6.
In the same preparation, 5HT induces an increase in all recorded Dep MNs involved in resistance reflex. A, The four simultaneous intracellular recordings from Dep MNs (Dep MN1, Dep MN2, Dep MN3, and Dep MN4) display a cyclic resistance reflex response to sinewave movements imposed on the CBCO strand in control situation (1 and gray traces). In the presence of 5HT (black traces), the four Dep MNs are depolarized, and the amplitude of their responses is increased (most visible at t = 25 min; 2). On the right are displayed superimposed averages (n = 20) of the responses under control (1) and 5HT (2) conditions. In the control condition, the membrane potentials of Dep MN1, Dep MN2, Dep MN3, and Dep MN4 were -63, -78, -64, and -65 mV, respectively. Dep n, Extracellular recording from the depressor nerve; CBCO n, extracellular recording from the CBCO nerve; mvt, sinewave movement applied to the CBCO strand. B, Enlarged view of CBCO nerve activity during one movement cycle in control (1) and 5HT condition (2).
Figure 5.
Figure 5.
Diversity of MN response to 5HT. A, B, Raw data of two intracellularly recorded Dep MNs (A, Dep MN 1; B, Dep MN 2) showing resistance reflex responses to a sinewave movement imposed on the CBCO in two experiments before (left, control) and after (right, 25 min 5HT) 5HT exposure. Although 5HT induces an increase in Dep MN1 reflex response, 5HT has no effect on the intracellularly recorded Dep MN2. Resting membrane potentials in control situation were -78 and -62 mV for Dep MN1 and Dep MN2, respectively. In the presence of 5HT, Dep MN1 showed a tonic depolarization of 3 mV (not visible because traces are aligned for better appreciation of the enhancement of the response in the presence of 5HT). No tonic depolarization was observed in Dep MN2 in the presence of 5HT.
Figure 7.
Figure 7.
Evidence that 5HT has no effect on Dep MNs in some preparations. The experimental paradigm is the same as that in Figure 6.A, Three simultaneous intracellular recordings were performed from Dep MNs involved in resistance reflex (Dep MN1, Dep MN2, and Dep MN3). In the control condition, the membrane potentials of Dep MN1, Dep MN2, and Dep MN3 were -75, -74, and -74 mV, respectively. In the presence of 5HT, no tonic depolarization and no change in reflex response occurred. B, Enlarged view of CBCO nerve activity during one movement cycle in control (1) and 5HT condition (2).
Figure 8.
Figure 8.
5HT increases input resistance in Dep MNs. A, B, In two intracellularly recorded Dep MNs (A, Dep MN1; B, Dep MN2), sinewave movements (mvt) applied to CBCO strand evoked a typical resistance reflex response (gray trace, Control) that was increased in the presence of 5HT (black trace, 5HT). Each trace is an average of n = 12 cycles. C, D, Measurement of the input resistance of the two Dep MNs recorded in A and B. In both cases, the input resistance increased in the presence of 5HT. E, F, Repolarization time constant (τ) measured from C and D (see boxes). Estimations of τ were made on average traces (n = 10) after fitting each recording with one exponential decay curve (R2 > 0.95). The first few milliseconds were not taken into account for the calculation. Experiments in which the electrode capacitance was too high were rejected. In both cases, time constant was increased in the presence of 5HT. G, Relative changes in reflex response (percentage of control response) are correlated with changes in input resistance (Rin, open squares; R2 = 0.91) and changes in time constant (τ, filled triangles; R2 = 0.76). Moreover, Rin and τ were significantly paired (paired t test; p < 0.05).
Figure 9.
Figure 9.
Effect of 5HT on unitary EPSPs recorded from a Dep MN and triggered by release-sensitive CBCO units. A, Mean response of a Dep MN to 10 sinewave movements applied to the CBCO strand in control and 5HT conditions. B, C, Average traces of unitary EPSPs recorded from the Dep MN shown in A (for statistics, see Table 1). Each unitary EPSP was triggered by a CBCO unit (Unit) extracellularly recorded from the CBCO nerve. The shape of each of these sensory units is presented on the left of each EPSP trace. The activity of each sensory unit during sinewave movement is represented by an event distribution histogram calculated over 10 sinusoidal movement cycles. Vertical scale represents the number of spikes per bin averaged per cycle (bin size, 50 msec; number of bins, 200). The movement cycle is represented below each graph. All of the units are activated during the release movement. For each unitary EPSP, two superimposed traces are presented corresponding to control (gray trace) and 5HT (black trace) conditions. Six EPSPs did not present any enhancement after 5HT application (B), and two EPSPs displayed a marked enhancement (C). D, Superimposed Dep MN EPSPs (n = 18) triggered by Unit28 are presented in control (left) and 5HT (right) conditions.
Figure 10.
Figure 10.
Stationarity of unitary EPSP amplitude during release movement. A, Averaged unitary Dep MN EPSP triggered by a CBCO unit extracellularly recorded from the CBCO nerve in control (gray line; n = 735) and 5HT (black line; n = 675) conditions. B, C, Statistical analysis of the amplitude of this unitary EPSP against the phase of imposed movement. B, Plot of the amplitude of all unitary EPSPs recorded during 300 sec in control (left) and 5HT (right) conditions, against the phase of the sinewave movement imposed on the CBCO strand (mvt). Distribution histograms are presented on the right of each plot. C, Histograms representing the mean amplitude of unitary EPSPs against the phase of imposed movement. The movement cycle was divided into 10 bins. Error bars represent SE. Open bars represent discharge frequency of the unit below 1 Hz. D, Frequency distribution of the events (Unit Freq.) along the phase of imposed movement.
Figure 11.
Figure 11.
Polysynaptic pathways are involved in the 5HT-induced enhancement of the resistance reflex response. A, Intracellular averaged (n = 13) responses of a Dep MN to application of a sinewave movement to the CBCO strand in successive conditions. A1, The intracellularly recorded Dep MN displays a resistance reflex response (control). A2, In the presence of the high divalent cation solution, the amplitude of the control response is decreased (High Ca Mg). A3, After 40 min washing (Wash) of the high divalent cation solution, the Dep MN response is not restored. A4, When 5HT is applied, the amplitude of the response is greatly increased (25 min 5HT). A5, This large increase disappears in the presence of high divalent cation solution (5HT + High Ca Mg). B, Comparison of the effects of 5HT in normal saline and in a high divalent cation solution on the Dep MN recorded in A. B1, In normal saline, 5HT induces an increase in the resistance reflex response. B2, In a high divalent cation solution, 5HT has almost no effect on the resistance reflex response. C, Averaged unitary EPSPs triggered by two CBCO units (C1 and C2; same procedure as in Fig. 9 B, C) and recorded from the same Dep MN as in A and B. These two unitary EPSPs were recorded in three conditions, and the averaged traces (n = 50) corresponding to control (Control, gray trace), 5HT (25 min 5HT, black trace), and 5HT in the presence of high divalent cation solution (5HT + High Ca Mg, dotted line) are superimposed.
Figure 13.
Figure 13.
Model of temporal summation. A, In a volley containing only two EPSPs, the amplitude (V1) of the second EPSP is smaller than the amplitude (V0) of the first EPSP, because the second EPSP summates with the falling phase of the first EPSP. B, In a volley of n EPSPs, the maximum amplitude (V) of the volley reaches rapidly a steady state. In this steady state, the amplitude of each EPSP is smaller than the amplitude V0 of the first EPSP or an isolated EPSP. C, Modeling of EPSPs by an instantaneous depolarization (V0) followed immediately by a single exponential falling phase (see Results for explanations). D, E, More realistic model of the EPSP summation. D, To model the delay attributable to the discrete rising phase, the amplitude of the model EPSP was artificially increased by a factor K. With this new amplitude (K.V0), the falling phase of the realistic model EPSP (black trace) fits perfectly the real EPSP falling phase (gray trace). E, With this more realistic model, the summation of EPSPs (black traces) fits the summation of real shape EPSPs (gray traces). The maximum amplitude (V) is obtained by the addition of an EPSP with an amplitude V0 to the series of model EPSPs with an amplitude K.V0.
Figure 12.
Figure 12.
Effect of 5HT on isolated EPSPs. A-C, Intracellular recordings from a Dep MN showing unitary EPSPs triggered by a CBCO unit in control condition (A, gray traces) and after 5HT application (B, black traces). In A1 and B1 are presented six superimposed EPSPs (raw data) recorded in the absence of movement (isolated EPSPs). In A2 and B2 are presented 13 superimposed EPSPs (raw data) recorded during sinewave movements applied to the CBCO strand (EPSP in a volley). C, Average traces (n = 150 for each trace) of the unitary EPSPs shown in A and B (gray traces, control condition; black traces, after 5HT application).

References

    1. Alvarado-Alvarez R, Arechiga H, Garcia U (2000) Serotonin activates a Ca(2+)-dependent K(+) current in identified peptidergic neurons from the crayfish. J Exp Biol 203: 715-723. - PubMed
    1. Baines RA, Tyrer NM, Downer RG (1990) Serotoninergic innervation of the locust mandibular closer muscle modulates contractions through the elevation of cyclic adenosine monophosphate. J Comp Neurol 294: 623-632. - PubMed
    1. Beltz BS, Kravitz EA (1983) Mapping of serotonin-like immunoreactivity in the lobster nervous system. J Neurosci 3: 585-602. - PMC - PubMed
    1. Cantrell AR, Catterall WA (2001) Neuromodulation of Na+ channels: an unexpected form of cellular plasticity. Nat Rev Neurosci 2: 397-407. - PubMed
    1. Cattaert D, El Manira A (1999) Shunting versus inactivation: analysis of presynaptic inhibitory mechanisms in primary afferents of the crayfish. J Neurosci 19: 6079-6089. - PMC - PubMed

Publication types

LinkOut - more resources