. 2004 Jan 14;24(2):462-73.
doi: 10.1523/JNEUROSCI.3040-03.2004.

Keratan sulfate proteoglycan phosphacan regulates mossy fiber outgrowth and regeneration

Affiliations

Keratan sulfate proteoglycan phosphacan regulates mossy fiber outgrowth and regeneration

Christy D Butler et al. J Neurosci. .

Abstract

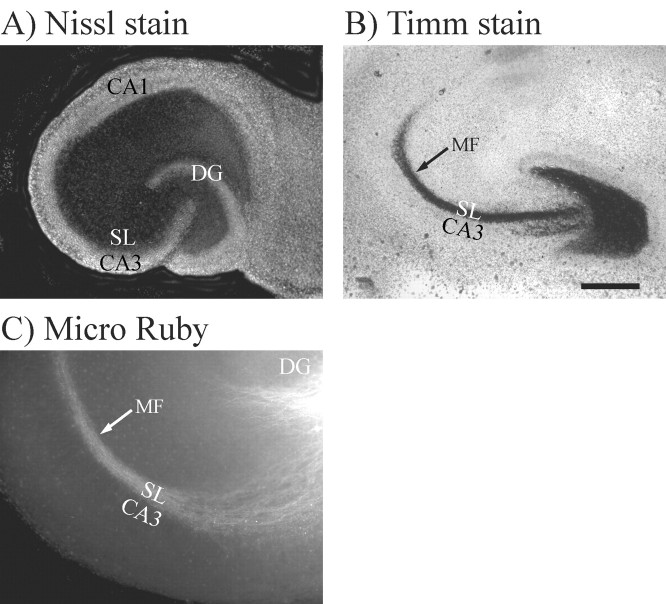
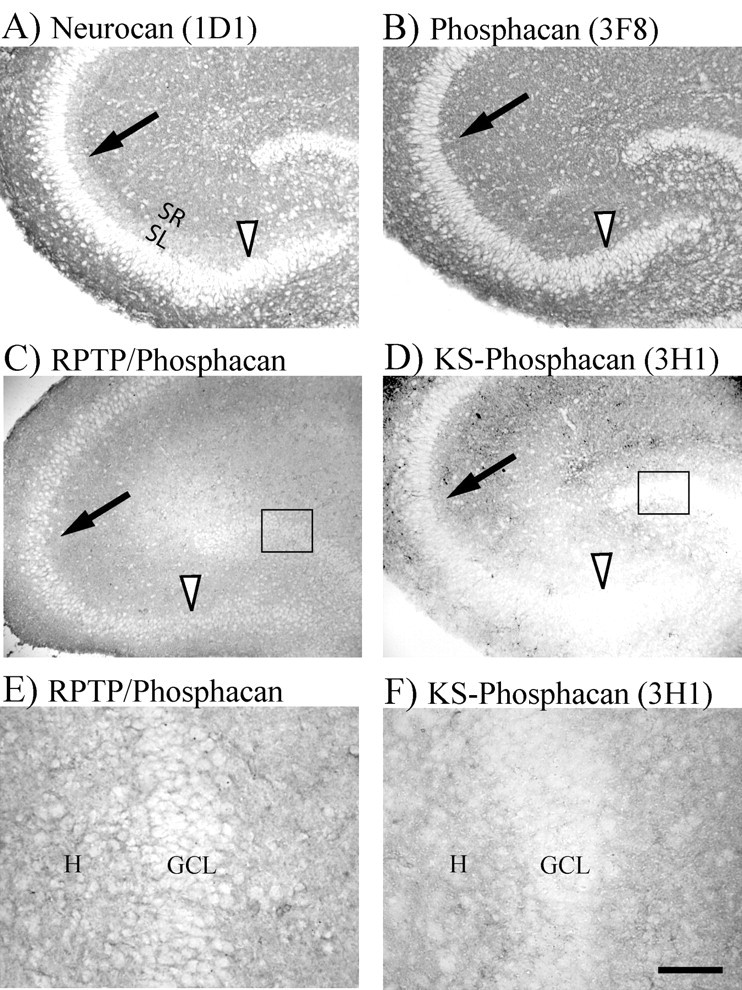
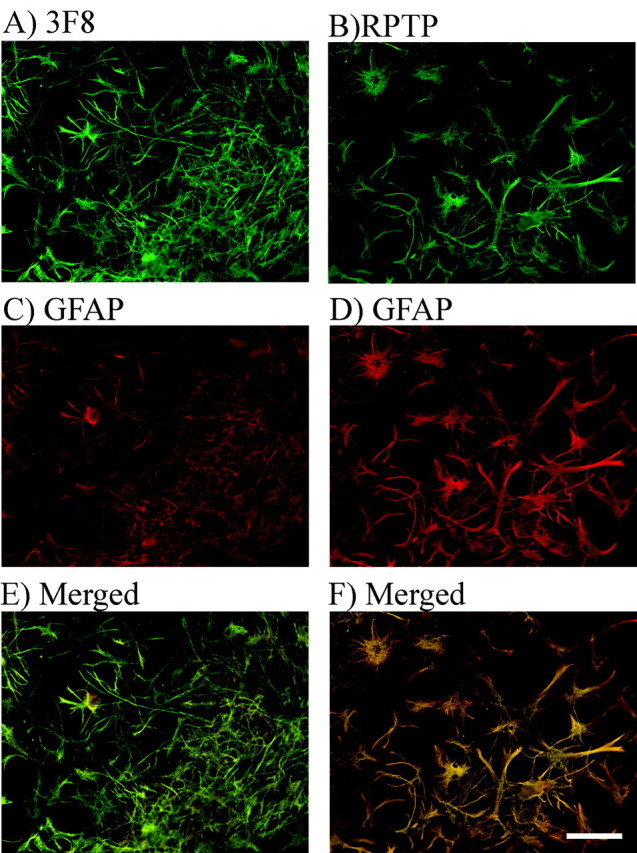
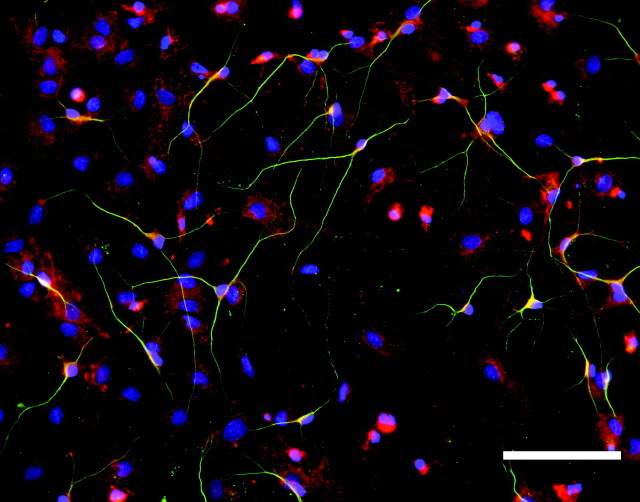
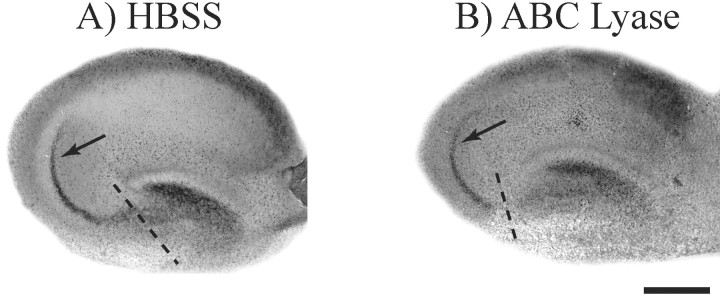
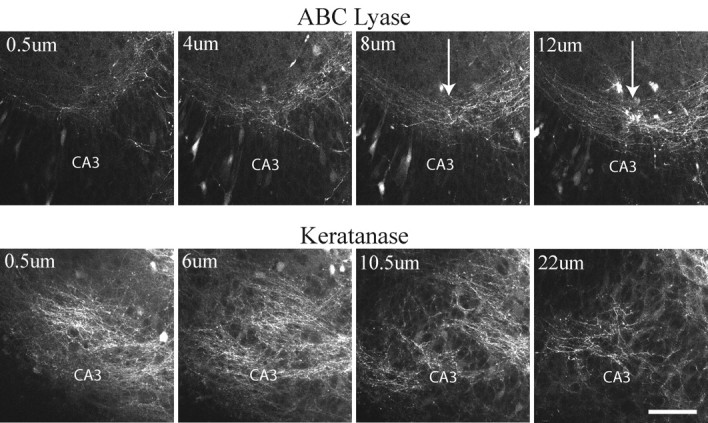
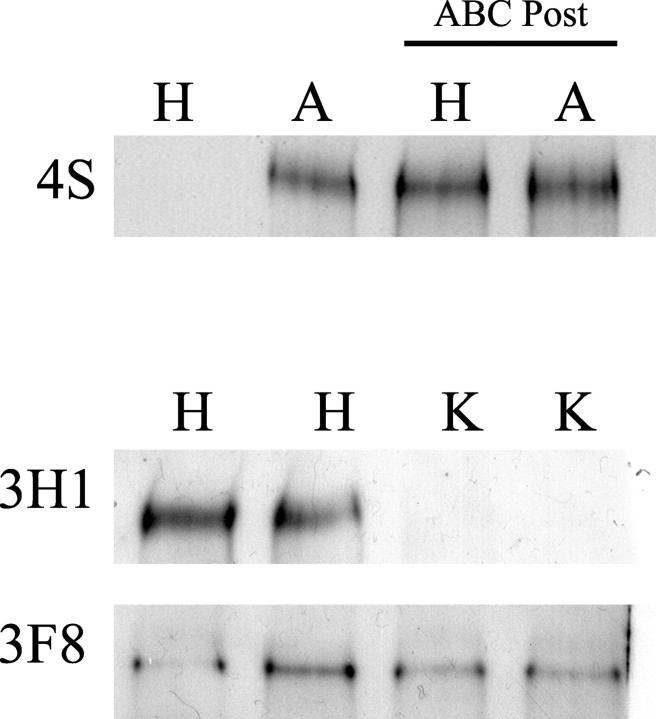
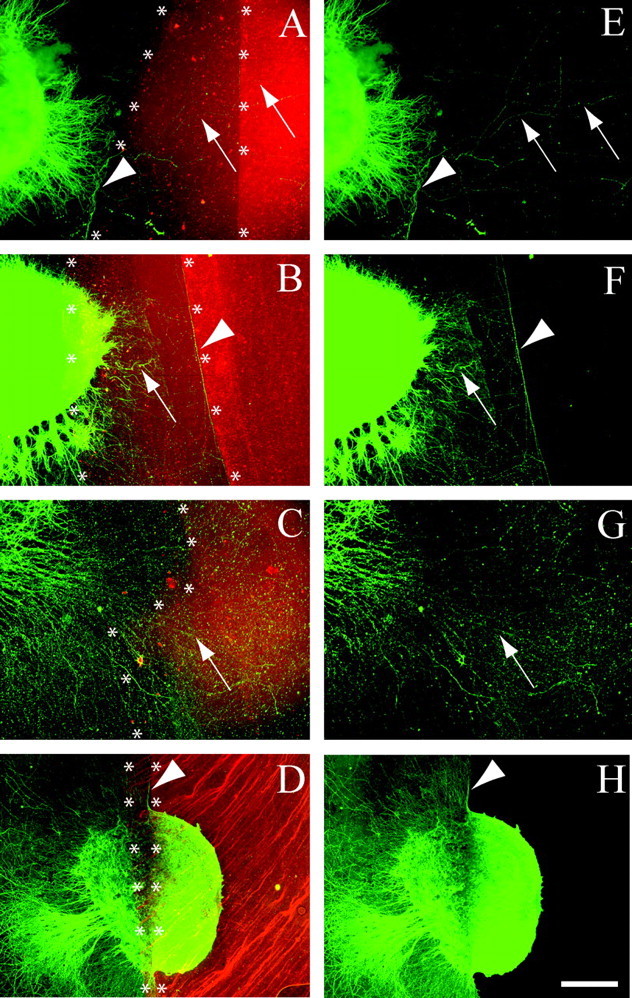
We have examined the role of chondroitin sulfate proteoglycans (CSPGs) and keratan sulfate proteoglycans (KSPGs) in directing mossy fiber (MF) outgrowth and regeneration in rat hippocampal slice cultures. MFs normally exhibit a very specific innervation pattern that is restricted to the stratum lucidum (SL). In addition, MFs in hippocampal slice cultures will regenerate this specific innervation pattern after transection. CSPGs are one of the best characterized inhibitory axon guidance molecules in the CNS and are widely expressed in all areas of the hippocampus except SL. KSPGs are also widely expressed in the hippocampus, but their role in axon outgrowth has not been extensively studied in the CNS where phosphacan is the only protein that appears to contain KS-GAGs. Cultured hippocampal slices were treated with either chondroitin ABC lyase or keratanases to reduce the inhibitory axon guidance properties of CS and KS proteoglycans, respectively. The ability of transected MFs to regenerate their normal innervation pattern after digestion of CS and KS-GAGS sugars with these enzymes was examined. Only keratanase treatment resulted in misrouting of MFs. Identifying the mechanism by which keratanase produced MF misrouting is complicated by the presence of splice variants of the phosphacan gene that include the extracellular form of phosphacan and the transmembrane receptor protein tyrosine phosphatase beta/zeta (RPTPbeta/zeta). Both forms of phosphacan are made by astrocytes, suggesting that keratanase alters MF outgrowth by modifying astrocyte function.


Figures

Figure 1.
Figure 1.
Mossyfibers (MFs) exhibited their normal distribution within stratum lucidum (SL) in hippocampal slice cultures maintained in culture for 7 d. A, The cultured slices were stained with fluorescent Nissl stain to demonstrate the presence of the CA1 and CA3 pyramidal cell layers and the granule cell layer in the dentate gyrus (DG). B, MF presynaptic terminals were stained black using Timm stain (black arrow), which recognizes the high concentration of zinc packaged in MF synaptic vesicles. The black band that represents the MF terminals also defines the SL, which is a narrow band located just above the CA3 pyramidal cell bodies. Thus, the SL and the MF terminal field form a precise banding pattern that lies over the proximal apical dendrites of CA3 pyramidal neurons but stop at the border between areas CA3 and CA1. C, This same precise banding pattern within SL can also be seen when MF axons (white arrow) were visualized by stereotaxically injecting fluorescent Micro Ruby dye into the granule cell layer of living cultures. Scale bars: A, B, 500 μm; C, 200 μm.
Figure 2.
Figure 2.
Distribution of neurocan and three forms of phosphacan in cryostat sections from P7 rat hippocampus. A, Neurocan immunostaining was lower in the MF termination zone (SL) compared with stratum radiatum (SR). Thus, neurocan appears to form an inhibitory CSPG border (arrow) that could inhibit MFs in SL from growing into SR. The CA3 pyramidal cell layer also showed light staining (arrowhead). B-F, Three different antibodies were used to stain the different types of phosphacan. B, Extracellular phosphacan containing only CS-GAGs was stained using 3F8 antibody, which showed an even distribution throughout all layers of the hippocampus. C, RPTPβ/ζ immunostaining (cytosolic epitope) also showed even staining throughout the hippocampus. Note that the intensity of RPTPβ/ζ staining was enhanced using Photoshop to facilitate comparisons with the other two forms of phosphacan. D, Phosphacan containing extracellular KS-GAGs was stained using the 3H1 antibody which showed relatively low staining throughout all areas of CA3 proximal to the DG, including the CA3 pyramidal cell layer (arrowhead). Note that RPTPβ/ζ is strongly distributed between neuronal cell bodies, whereas 3H1-immunoreactive extracellular KS-phosphacan is only weakly distributed between the cell bodies (boxed areas in C and D shown at higher magnification in E and F). GCL, Granule cell layer; H, hilus. Scale bars: A—D, 200 μm; E, F, 50 μm.
Figure 3.
Figure 3.
RPTPβ/ζ and extracellular phosphacan are expressed by astrocytes in dissociated DG cultures. Dissociated DG cultures were stained green using 3F8 (A) and anti-RPTPβ/ζ antibodies (B). Astrocytes in both sets of cultures were stained red with anti-GFAP antibody (C, D). The red and green merged images demonstrated that both extracellular phosphacan and RPTPβ/ζ were expressed by astrocytes (yellow staining, E and F). The same results were obtained in cultures stained for 3H1 and GFAP (data not shown). Scale bar, 100 μm.
Figure 4.
Figure 4.
Neurons in dissociated DG cultures do not express phosphacan. Neurons in the same group of dissociated DG cultures shown in Figure 3 were stained green using anti-β-tubulin antibodies. Extracellular phosphacan in the cultures was stained red using the 3F8 antibody. Nuclei were stained blue using DAPI. The merged image shows little yellow, indicating very limited overlap between 3F8 and β-tubulin staining. Scale bar, 200 μm.
Figure 5.
Figure 5.
Chondroitin ABC lyase does not alter MF regeneration. Cultured hippocampal slices were treated with chondroitin ABC lyase to enzymatically digest CS-GAGs, and control slices were treated with HBSS. MFs in these two groups of slices were then transected (dashed lines) and allowed to regenerate for 5 d. Timm stain was used to determine whether MFs regenerated their normal synaptic pattern in SL as shown in Figure 1B. The data show that cultures treated with HBSS (A) and those treated with chondroitin ABC lyase (B) both regenerated their normal synaptic pattern within SL (arrows). Scale bar, 500 μm.
Figure 6.
Figure 6.
Confocal images show that MFs regenerated in a disorganized manner when hippocampal slice cultures were treated with keratanase. Slices were treated with either chondroitin ABC lyase or keratanase II. MFs were stained by injecting Micro Ruby into the granule cell layer of living slices. A series of 0.5-μm-thick optical sections were taken through the slices using a Leica TCS SP2 confocal microscope. Whereas MFs regenerated their normal pattern within the SL in ABC lyase-treated slices (arrows), MFs in keratanase-treated slices wandered laterally into stratum pyramidale and stratum radiatum. MFs in keratanase-treated cultures also appeared to spread more in the vertical plane of the cultures. Scale bar, 100 μm.
Figure 7.
Figure 7.
Western analysis demonstrated that chondroitin ABC lyase and keratanase treatments were effective at removing CS- and KS-GAG sugars from proteoglycans in living hippocampal cultures. Hippocampal cultures were treated with either HBSS (H), ABC lyase (A), or a mixture of keratanases I+II (K). First, Western analysis was performed using the 4S antibody, which only recognizes CSPGs after ABC lyase has removed CS-GAGs but does not recognize intact CSPGs. The 4S Western blot showed no staining in H-treated cultures and a strong band in the A-treated cultures (n = 3). To demonstrate that there were equal amounts of 4S-positive material in the homogenates of H- and A-treated cultures, aliquots of the same homogenates run in lanes 1 and 2 were post-treated with ABC lyase (ABC Post). The 4S-positve band from H-treated cultures was not significantly different from the band in A-treated cultures when the homogenates were post-treated with ABC lyase (n = 3, last two lanes). To test the effectiveness of keratanase treatment at removing KS-GAGs from phosphacan, Western analysis was performed on homogenates from slice cultures treated with either H or K. Because the 3H1 antibody recognizes KS-GAGs on phosphacan, the absence of a 3H1-positive band in homogenates from K-treated cultures demonstrated that our protocol was effective at removing KS-GAGs from phosphacan. The same blot was then stripped and reprobed for 3F8, which recognizes phosphacan without KS-GAGs. The intensity of the 3F8-positive band from K-treated cultures was not significantly different from those from H-treated cultures (n = 3), which demonstrates that keratanase treatment did not degrade non-KS forms of phosphacan.
Figure 8.
Figure 8.
MF outgrowth was inhibited by contact with CSPG but not KSPG substrates. DG explants were placed on a laminin substrate next to an area on which a mixture of brain proteoglycans was applied. Axons were stained green using anti-β-tubulin immunohistochemistry. Alexa 594 was added to the proteoglycan mixture to mark its location (red fluorescence). Two coats of the proteoglycan mixture were applied in a partially overlapping manner (see Materials and Methods), resulting in areas that contained 1 layer of proteoglycan (1×) and areas that contain two layers of proteoglycan (2×). The laminin and 1× proteoglycan border is marked by asterisks, as is the border between 1× and 2× proteoglycan substrates. The red and green images were merged to visualize how MF axons behaved when they encountered a proteoglycan border (asterisks). E-H are the same figures as A-D except that only the green β-tubulin staining is shown to facilitate observation of axons. Arrows and arrowheads identify the same axon segments in paired figures. Arrowheads identify axons that were inhibited by the proteoglycans substrate, whereas arrows identify axons that were not inhibited. A, E, When given a choice between laminin and proteoglycans, most MFs turned abruptly to avoid the proteoglycan mixture (n = 13). B, F, When DG explants were placed on a 1× concentration of proteoglycan, MFs extended onto the lower concentration (arrow) but turned to avoid a 2× step gradient (arrowhead, n = 22). In C and G, the same proteoglycan substrate was treated with chondroitin ABC lyase (10 U/ml for 3 hr) before plating DG explants. The substrate was washed to remove any remaining enzyme before plating the DG explants. In contrast to the results observed in A, MFs readily grew across the ABC lyase treated proteoglycans substrate in 38 of 43 cultures. Note that it was necessary to show images C and G at higher magnification to clearly observe axons that grow in a less fasciculated manner on the CSPG substrate that has been treated with ABC lyase. D, H, However, when the proteoglycan substrate was treated with the same concentration of keratanases I+II that removed KS-GAGs from cultured hippocampal slices (1 U/ml for 3 hr) (Fig. 7), MF outgrowth was still inhibited by the proteoglycan substrate in 51 of 57 cultures. In this figure the DG explant was placed so that it contacted laminin as well as the 1× and 2× concentrations of proteoglycan. As in explants placed directly on untreated proteoglycan substrate (B,F), MFs extended onto laminin and 1× proteoglycan substrates but were inhibited by the 2× proteoglycan substrate, even after keratanase treatment. These data show that MF outgrowth is inhibited by CSPG substrates and that this inhibition is diminished by chondroitin ABC lyase but not keratanase. Scale bar: A, B, D, E, F, H, 200 μm; C, G, 80 μm.
Figure 9.
Figure 9.
Western analysis demonstrated that keratanase reduces the phosphorylation of an 80 kDa protein. An anti-phosphotyrosine antibody was used to examine whether keratanase altered the phosphorylation of specific proteins in dentate explants. In control explants treated with HBSS, a strong band was present at ∼80 kDa. This band was not detectable in homogenates from cultures treated with keratanases I+II (KIK2).
Figure 10.
Figure 10.
Keratanase enhanced astrocyte migration from dentate and CA3 explants. Figures 2 and 3 demonstrated that RPTPβ/ζ is expressed by astrocytes and on astrocytic process located between the granule cell and CA3 pyramidal cell bodies. Dentate explants cultured on laminin were treated with keratanases I and II (K1K2), chondroitin ABC lyase (ABC), or HBSS to determine whether the enzyme treatment of the cell body area could alter astrocyte and MF outgrowth even when no CA3 target tissue was present. To measure astrocyte outgrowth, a circle was drawn around the outer border of the GFAP-positive astrocytic processes (arrows). A circle was then drawn around DAPI-stained explants to measure the area of the explant (data not shown). The explant can be observed as the densely stained areas in A-C, whose centers are marked by asterisks. The area of astrocyte outgrowth minus the area of the explant was then divided by the area of the explant to normalize the outgrowth data for different-sized explants. The log of this ratio was calculated to perform a linear transformation of the data for statistical analysis. The outgrowth of astrocytes in K1K2 treated dentate explants was statistically greater than the outgrowth observed in ABC- or HBSS-treated explants (D). K1K2 treatment produced a similar increase in astrocyte outgrowth in CA3 explants (F). DG explants were also stained with β-tubulin to measure MF axon outgrowth (E). MF outgrowth was significantly enhanced in explants treated with K1K2 compared with those treated with HBSS. MF outgrowth in ABC-treated explants was not significantly different from HBSS-treated explants. ANOVA statistical analysis was performed using SigmaStat 3.0 software. *p < 0.001. Scale bar, 200 μm.
Figure 11.
Figure 11.
Models represent possible explanations of the data. A, In untreated hippocampus, MFs are hypothesized to follow attractive guidance cues in SL (+ signs). Inhibitory extracellular CSPGs also surround SL (red - signs). B, Treatment with chondroitin ABC lyase reduces the inhibitory extracellular CSPGs (-), but MFs can still follow positive cues (+) to regenerate their normal pattern. Thus, extracellular CSPGs surrounding SL do not appear to be the primary guidance molecules used by MFs. Furthermore, the data in Figure 8, C and G, demonstrated that keratanase does not reduce inhibition of extracellular KSPGs, and Figure 8, D and H, demonstrated that extracellular KS-GAGs do not inhibit MF outgrowth. Thus, keratanase-induced changes in MF outgrowth appear to involve either the direct or indirect alteration of astrocyte function. Direct changes in RPTPβ/ζ activity could alter the interaction of astrocytes and granule cells to produce a change in axon guidance receptors expressed on MF growth cones (C) and/or alter the expression of guidance molecules by astrocytes in area CA3 (D). Similar changes in the expression of guidance molecules or receptors also could be initiated by indirect mechanisms resulting from the loss of KS from extracellular phosphacan.

References

    1. Altman J, Das GD (1965) Autoradiographic and histological evidence of postnatal hippocampal neurogenesis in rats. J Comp Neurol 124: 319-336. - PubMed
    1. Alvarez-Royo P, Zola-Morgan S, Squire LR (1992) Impairment of long-term memory and sparing of short-term memory in monkeys with medial temporal lobe lesions: a response to Ringo. Behav Brain Res 52: 1-5. - PubMed
    1. Asher RA, Morgenstern DA, Moon LD, Fawcett JW (2001) Chondroitin sulphate proteoglycans: inhibitory components of the glial scar. Prog Brain Res 132: 611-619. - PubMed
    1. Brittis PA, Canning DR, Silver J (1992) Chondroitin sulfate as a regulator of neuronal patterning in the retina. Science 255: 733-736. - PubMed
    1. Burden-Gulley SM, Brady-Kalnay SM (1999) PTPmu regulates N-cadherin-dependent neurite outgrowth. J Cell Biol 144: 1323-1336. - PMC - PubMed

Publication types

LinkOut - more resources